Meteorographica examples: side-by-side regional plot
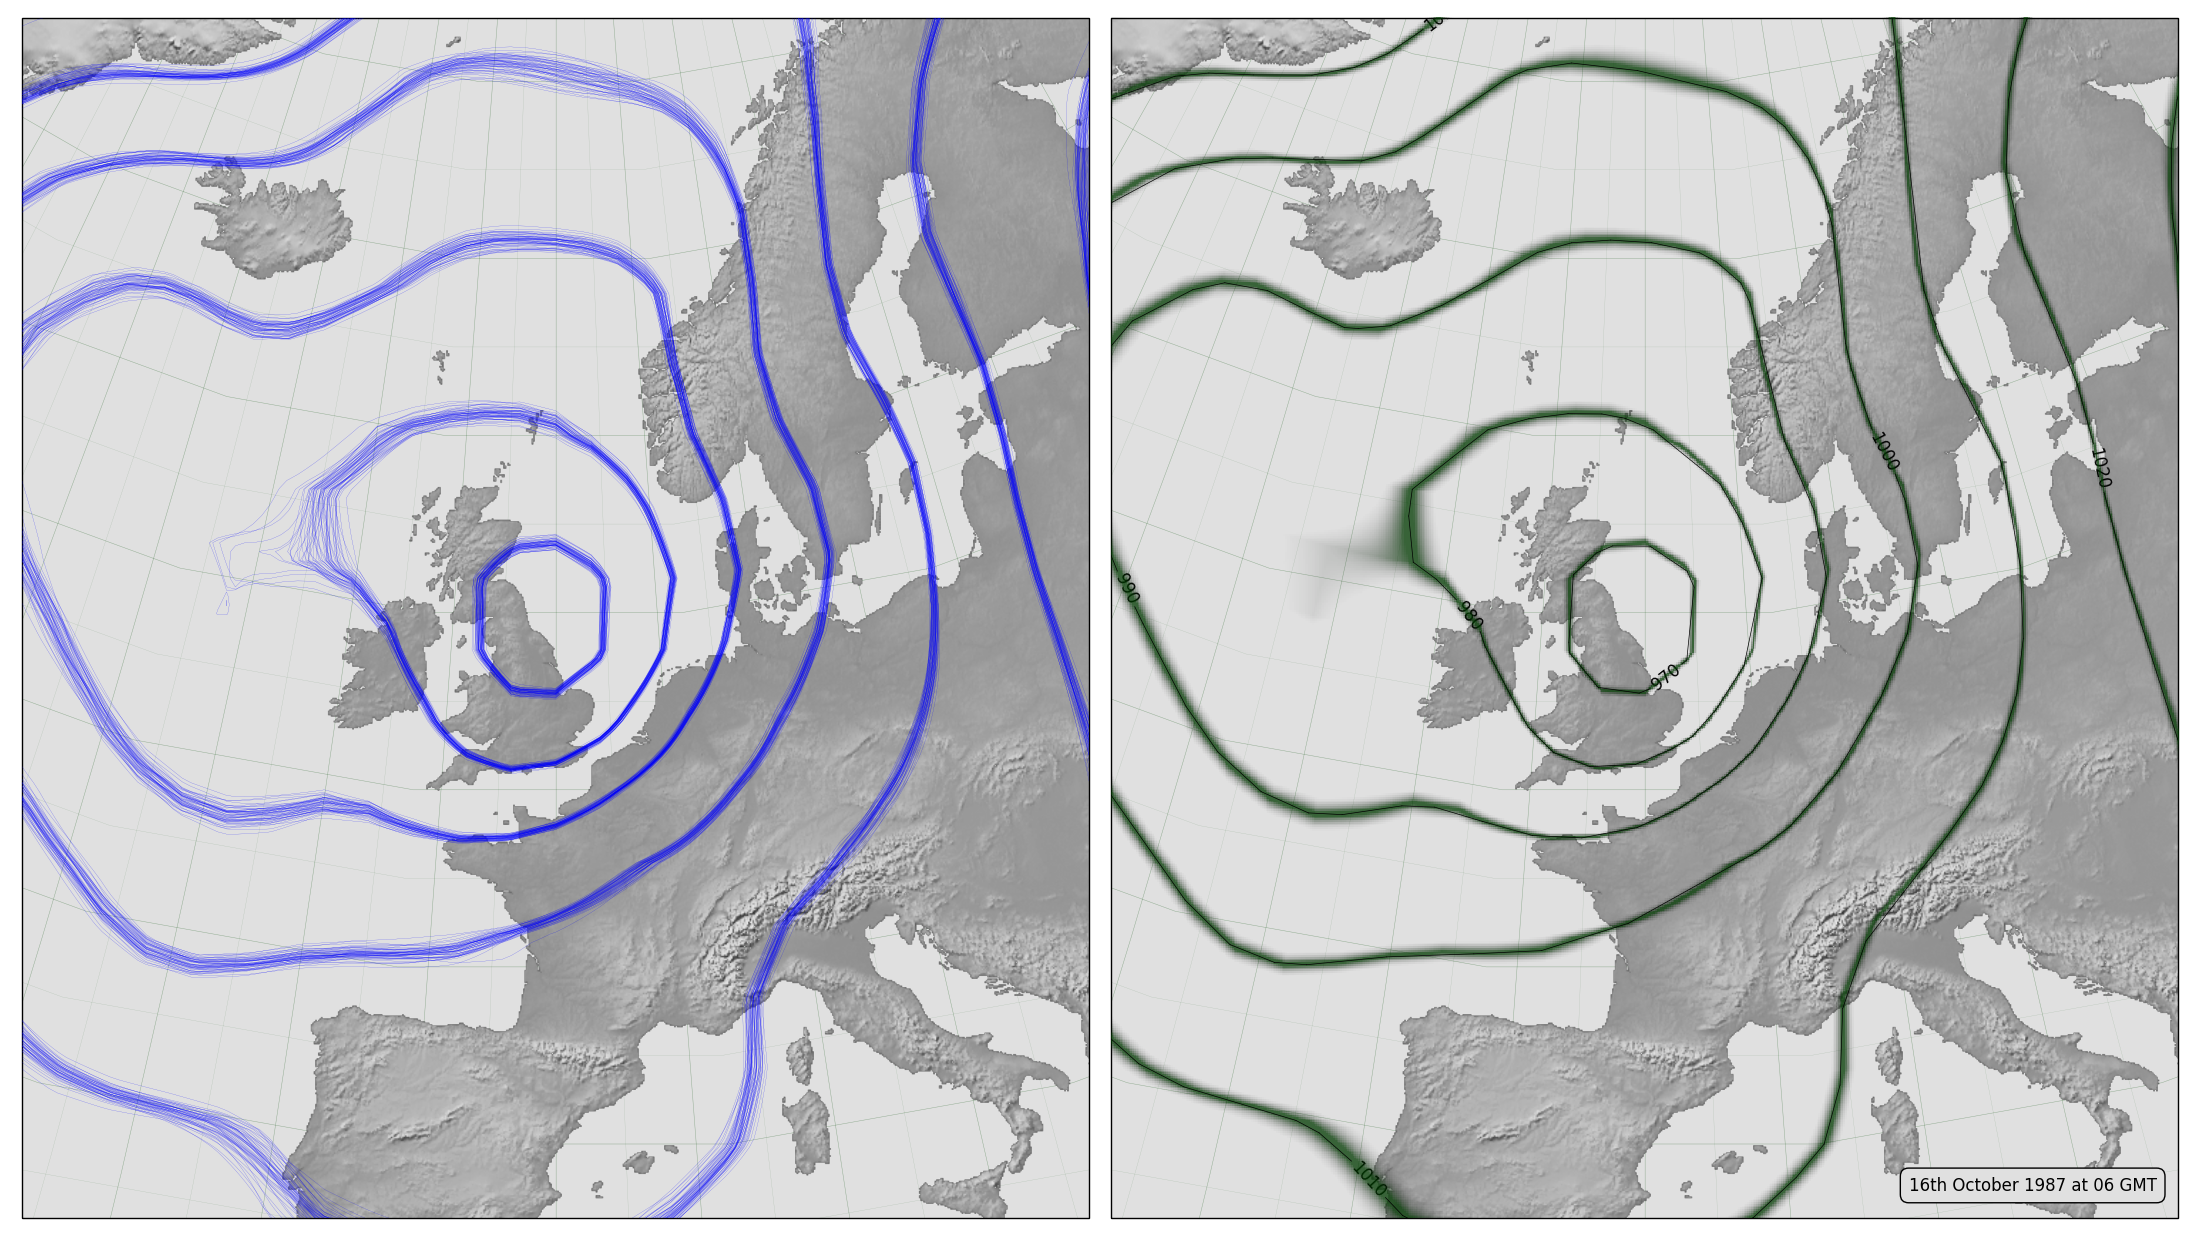
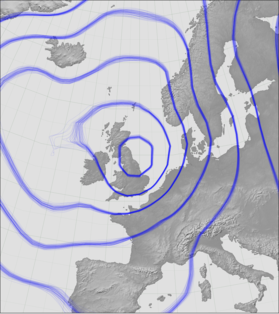
Side-by-side comparison plot of regional mslp. Two views of the same data - spaghetti plot on the left, contour-spread plot on the right.
# Meteorographica example script

# Set up the figure and add the continents as background
# Overlay pressure spaghetti plot

import Meteorographica as mg
import iris

import matplotlib
from matplotlib.backends.backend_agg import FigureCanvasAgg as FigureCanvas
from matplotlib.figure import Figure
import cartopy
import cartopy.crs as ccrs

import pkg_resources

# Define the figure (page size, background color, resolution, ...
aspect=16/9.0
fig=Figure(figsize=(22,22/aspect),              # Width, Height (inches)
           dpi=100,
           facecolor=(0.88,0.88,0.88,1),
           edgecolor=None,
           linewidth=0.0,
           frameon=False,                # Don't draw a frame
           subplotpars=None,
           tight_layout=None)
# Attach a canvas
canvas=FigureCanvas(fig)

# Get pressure ensemble
edf=pkg_resources.resource_filename(
      pkg_resources.Requirement.parse('Meteorographica'),
                 'example_data/20CR2c.1987101606.prmsl.nc')
prmsl=iris.load_cube(edf)

# UK-centred projection
projection=ccrs.RotatedPole(pole_longitude=180, pole_latitude=35)
scale=15
extent=[scale*-1,scale,scale*-2/aspect,scale*2/aspect]

# Two side-by side plots - each on its own axes
ax_l=fig.add_axes([0.01,0.01,0.485,0.98],projection=projection)
ax_r=fig.add_axes([0.505,0.01,0.485,0.98],projection=projection)

# Left hand side plot - spaghetti
ax_l.set_axis_off()
ax_l.set_extent(extent, crs=projection)
ax_l.background_patch.set_facecolor((0.88,0.88,0.88,1))

# Draw a lat:lon grid
mg.background.add_grid(ax_l,
                       sep_major=5,
                       sep_minor=2.5,
                       color=(0,0.3,0,0.2))
# Add the land
land_img=ax_l.background_img(name='GreyT', resolution='low')
# Add the spaghetti pressure plot
mg.pressure.plot(ax_l,prmsl,scale=0.01,type='spaghetti',resolution=0.25)

# Right hand side plot - spread
ax_r.set_axis_off()
ax_r.set_extent(extent, crs=projection)
ax_r.background_patch.set_facecolor((0.88,0.88,0.88,1))

# Draw a lat:lon grid
mg.background.add_grid(ax_r,
                       sep_major=5,
                       sep_minor=2.5,
                       color=(0,0.3,0,0.2))
# Add the land
land_img=ax_r.background_img(name='GreyT', resolution='low')
# Add the spaghetti pressure plot
mg.pressure.plot(ax_r,prmsl,scale=0.01,type='spread',resolution=0.05)

# Add a label showing the date
label="16th October 1987 at 06 GMT"
mg.utils.plot_label(ax_r,label,
                    facecolor=fig.get_facecolor(),
                    x_fraction=0.98)

# Render the figure as a png
fig.savefig('pressure_uncertainty_comparison.png')