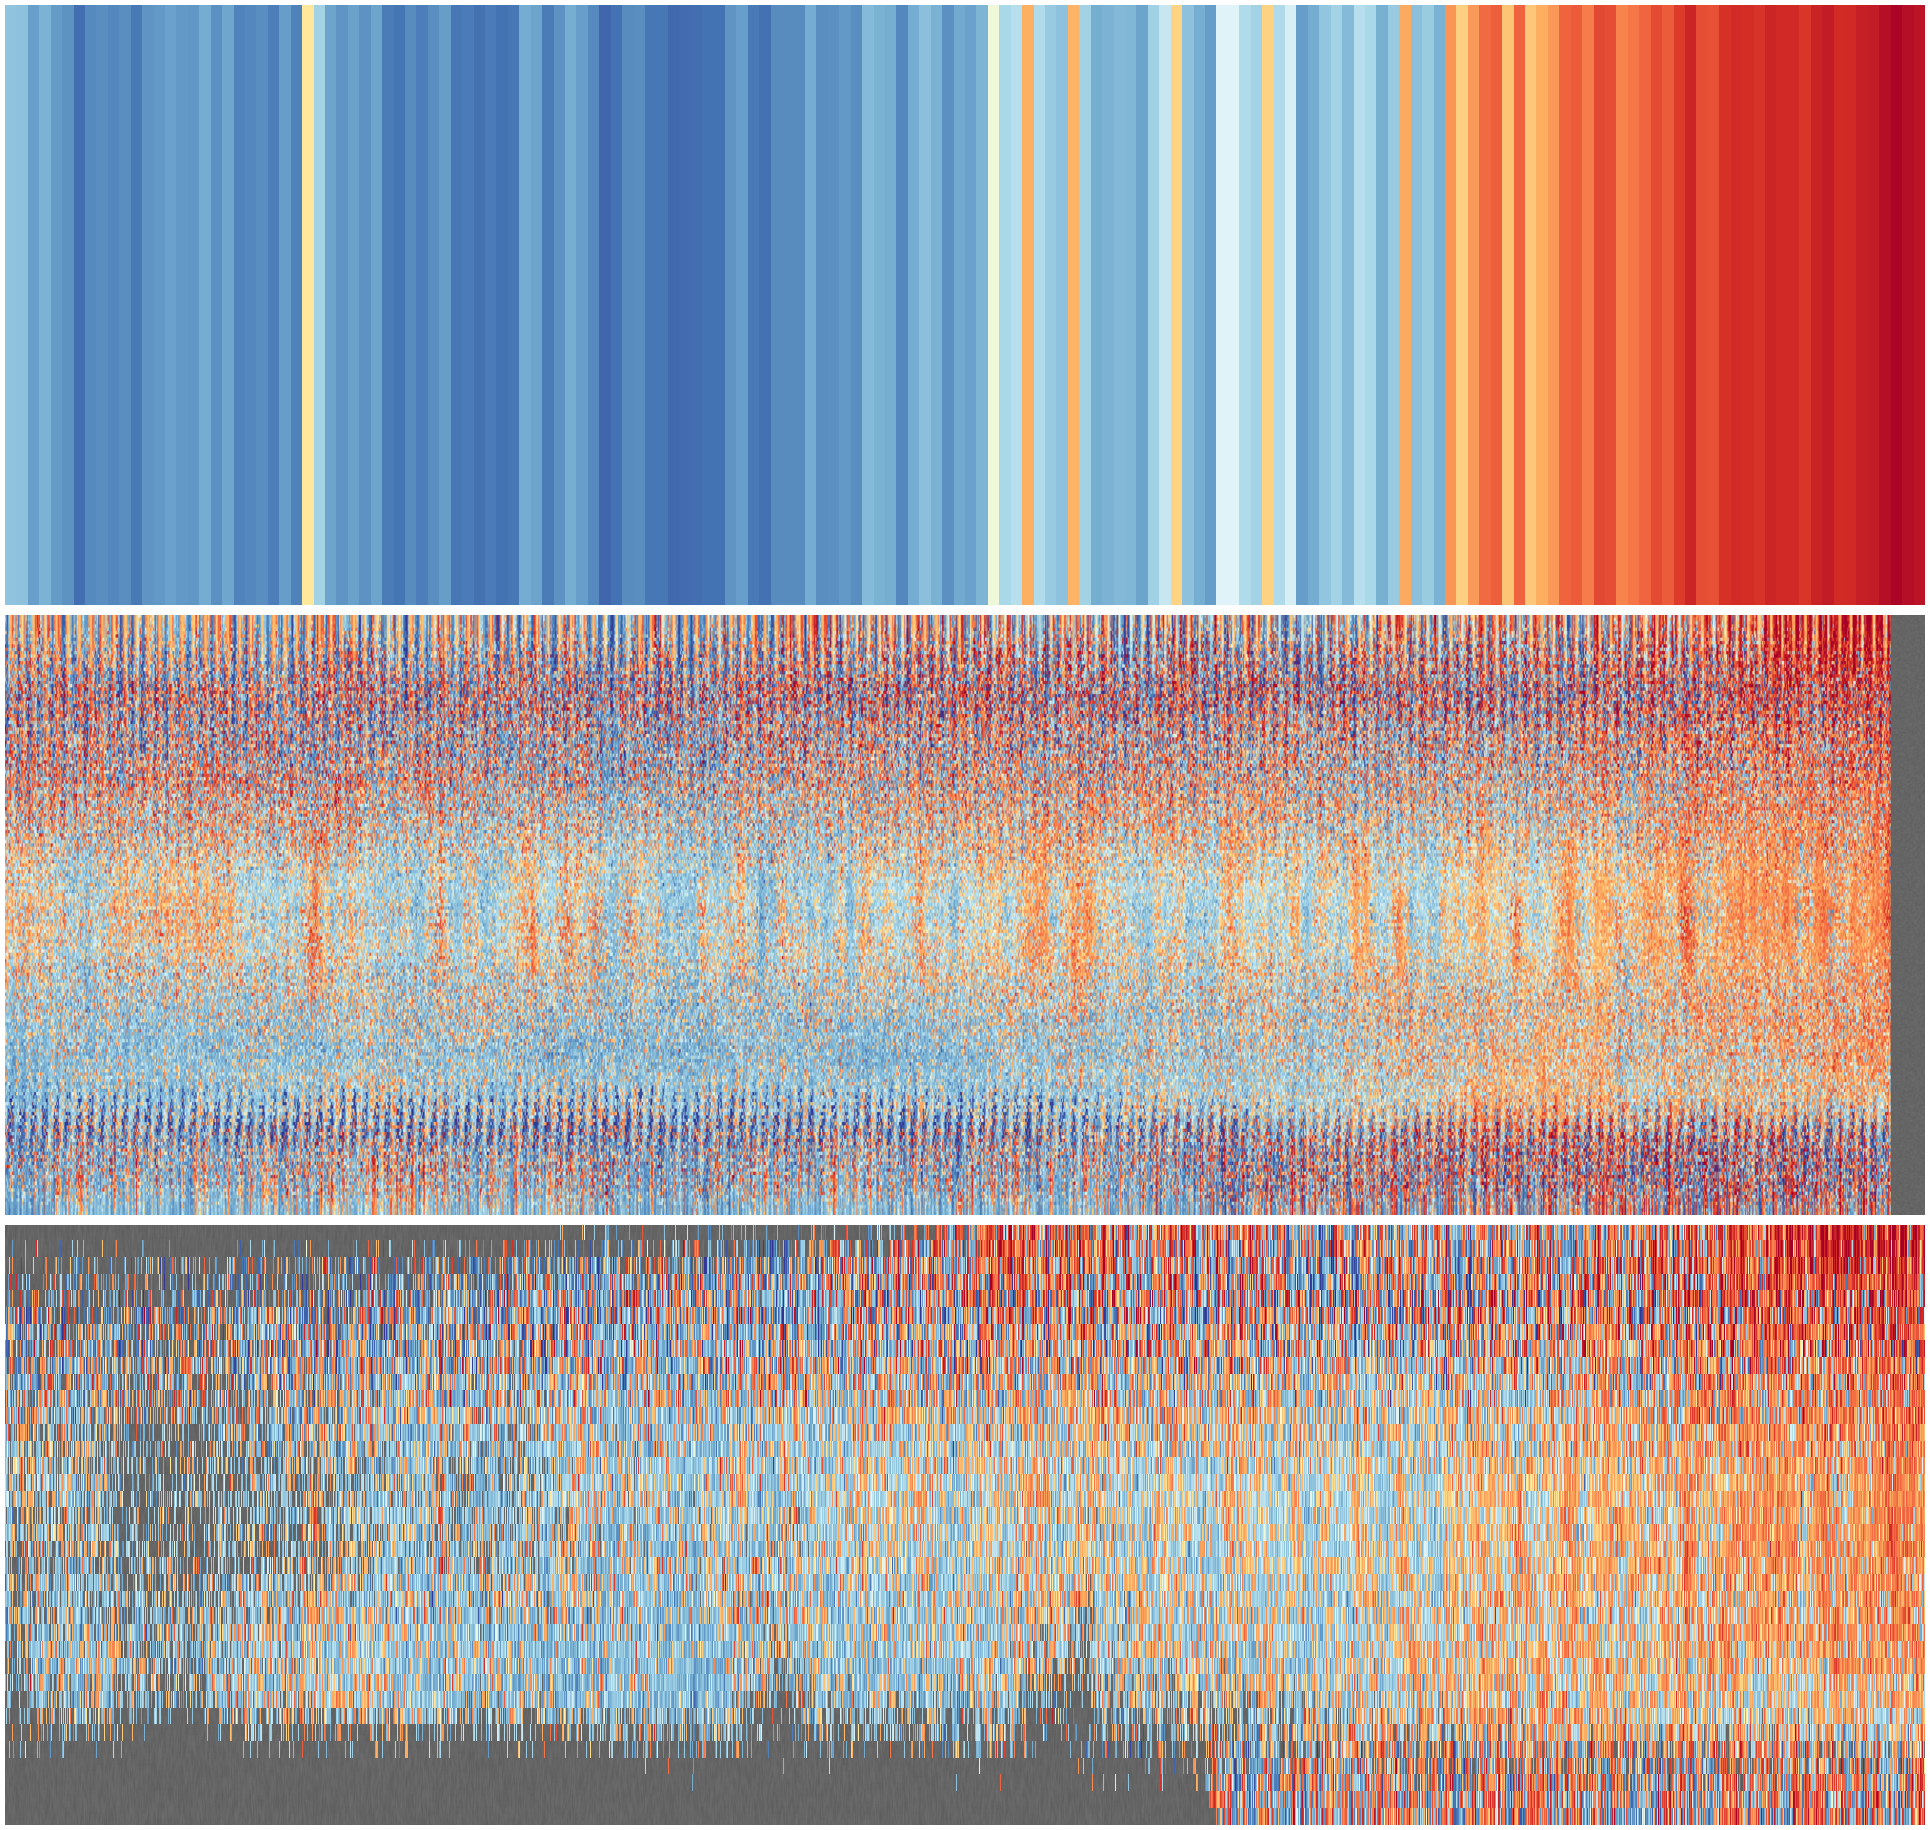
Get 20CRv3 data sample to plot as stripes
#!/usr/bin/env python

# Get a climate-stripes sample from 20CRv3
# Monthly, resolved in latitude, sampling in longitude,
#   mean across the ensemble.

import os
import sys
import iris
import numpy
import datetime
import pickle

start=datetime.datetime(1851,1,1,0,0)
end=datetime.datetime(2018,12,31,23,59)

sys.path.append('%s/../../../20CRv3/monthly_ensemble_mean/' %
                                  os.path.dirname(__file__))
from get_sample import get_sample_cube

egrid = iris.load_cube(("%s/EUSTACE/1.0/1969/"+
                        "tas_global_eustace_0_19690312.nc") %
                        os.getenv('SCRATCH'),
            iris.Constraint(cube_func=(lambda c: c.var_name == 'tas')))

# Make the climatology
n=[]
for m in range(1,13):
    mc=iris.Constraint(time=lambda cell: cell.point.month == m and \
                                         cell.point.year > 1960 and \
                                         cell.point.year < 1991)
    h=iris.load_cube('%s/20CR/version_3/monthly_means/air.2m.mon.mean.nc' %
                                                   os.getenv('SCRATCH'),
                 iris.Constraint(name='air_temperature') & mc)
    n.append(h.extract(mc).collapsed('time', iris.analysis.MEAN))

# Process in batches or we'll run out of memory.
rst = numpy.random.RandomState(seed=0)
dts=[]
ndata=None
for year in range(start.year,end.year+1,10):
    ey = min(year+10,end.year)
    (ndyr,dtyr) = get_sample_cube(datetime.datetime(year,1,1,0,0),
                                  datetime.datetime(ey,12,31,23,59),
                                  climatology=n,
                                  new_grid=egrid,rstate=rst)
    dts.extend(dtyr)
    if ndata is None:
        ndata = ndyr
    else:
        ndata = numpy.ma.concatenate((ndata,ndyr))

pickle.dump( (ndata,dts), open( "20CRv3.pkl", "wb" ) )
# Get the sample cube for 20CR

import os
import iris
import numpy
import datetime

def get_sample_cube(start=datetime.datetime(1851,1,1,0,0),
                    end=datetime.datetime(2018,12,31,23,59),
                    climatology=None,
                    climstart=1961,climend=1991,
                    new_grid=None,rstate=None):

    # Might want the longitude random sampling to be reproducible
    if rstate is None:
        r_lon = numpy.random.RandomState(seed=None)
    else:
        r_lon = rstate

    # Make the climatology, if not supplied
    if climatology is None:
        climatology=[]
        for m in range(1,13):
            mc=iris.Constraint(time=lambda cell: cell.point.month == m and \
                                                 cell.point.year > (climstart-1) and \
                                                 cell.point.year < (climend+1))
            h=iris.load_cube('%s/20CR/version_3/monthly_means/air.2m.mon.mean.nc' %
                                                           os.getenv('SCRATCH'),
                         iris.Constraint(name='air_temperature') & mc)
            climatology.append(h.extract(mc).collapsed('time', iris.analysis.MEAN))

    # Load the model data
    h=iris.load_cube('%s/20CR/version_3/monthly_means/air.2m.mon.mean.nc' %
                                                       os.getenv('SCRATCH'),
                     iris.Constraint(name='air_temperature') &
                     iris.Constraint(time=lambda cell: \
                                     start <= cell.point <=end))

    dts = h.coords('time')[0].units.num2date(h.coords('time')[0].points)

    # Anomalise
    for tidx in range(len(dts)):
        midx=dts[tidx].month-1
        h.data[tidx,:,:] -= climatology[midx].data

    if new_grid is not None:
        h = h.regrid(new_grid,iris.analysis.Nearest())

    # Sample in Longitude
    s=h.data.shape
    ndata=numpy.ma.array(numpy.zeros((s[0],s[1])),mask=True)
    for t in range(s[0]):
        for lat in range(s[1]):
            rand_l = r_lon.randint(0,s[2])
            ndata[t,lat]=h.data[t,lat,rand_l]
    return (ndata,dts)
