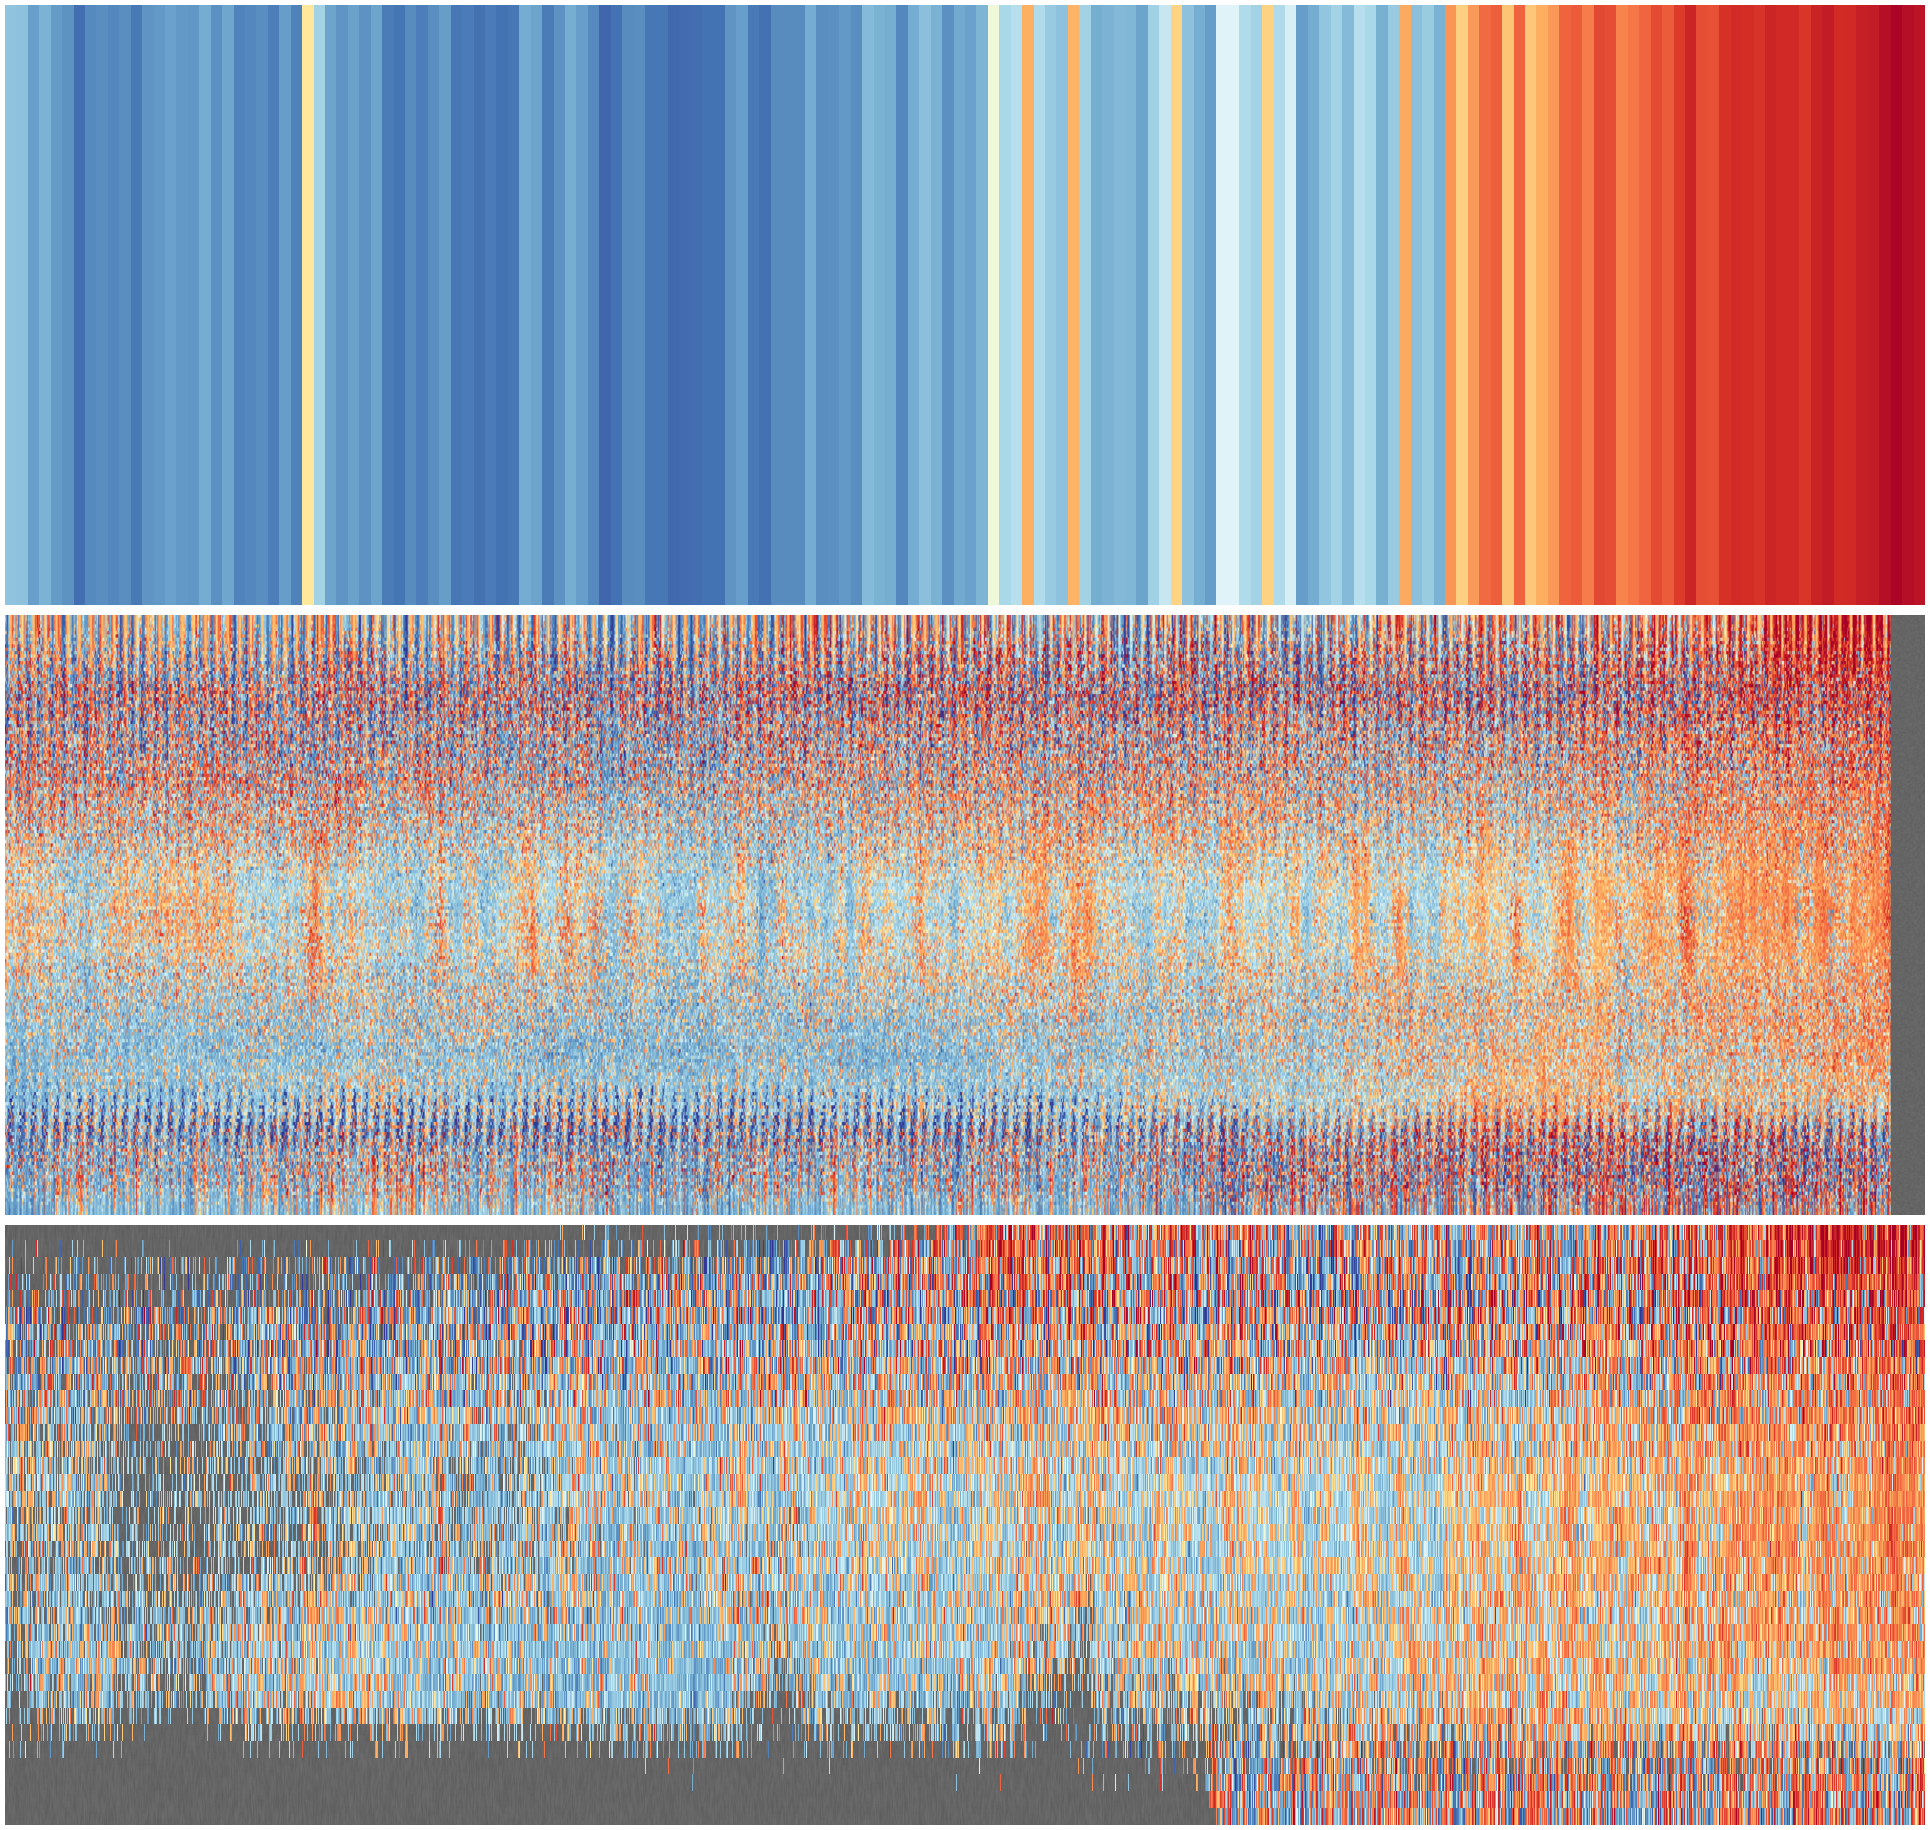
# Get the sample cube for EUSTACE
# Monthly, resolved in latitude, sampling in longitude, sampling the ensemble.

# Delegates making the slices to the parallelisable make_slice script.
# This script only puts the slices together.

import os
import iris
import numpy
import datetime
import pickle

def get_sample_cube(start=datetime.datetime(1851,1,1,0,0),
                    end=datetime.datetime(2018,12,31,23,59)):

    slice_dir = "%s/EUSTACE/derived/ensemble-monthly" % \
                                    os.getenv('SCRATCH')

    # Array to store the sample in
    ndata=numpy.ma.array(numpy.zeros(((2016-1850)*12,720)),mask=False)
    dts=[]
    # Assemble the sample slice by slice
    for year in range(1850,2016):
        for month in range(1,13):
            t=(year-1850)*12+month-1
            dfile = "%s/%04d%02d.pkl" % (slice_dir,year,month)
            with open(dfile, "rb") as f:
                dslice = pickle.load(f)
            ndata[t,:]=dslice[0,:]
            dts.append(datetime.datetime(year,month,15))

    return (ndata,dts)
