#!/usr/bin/env python
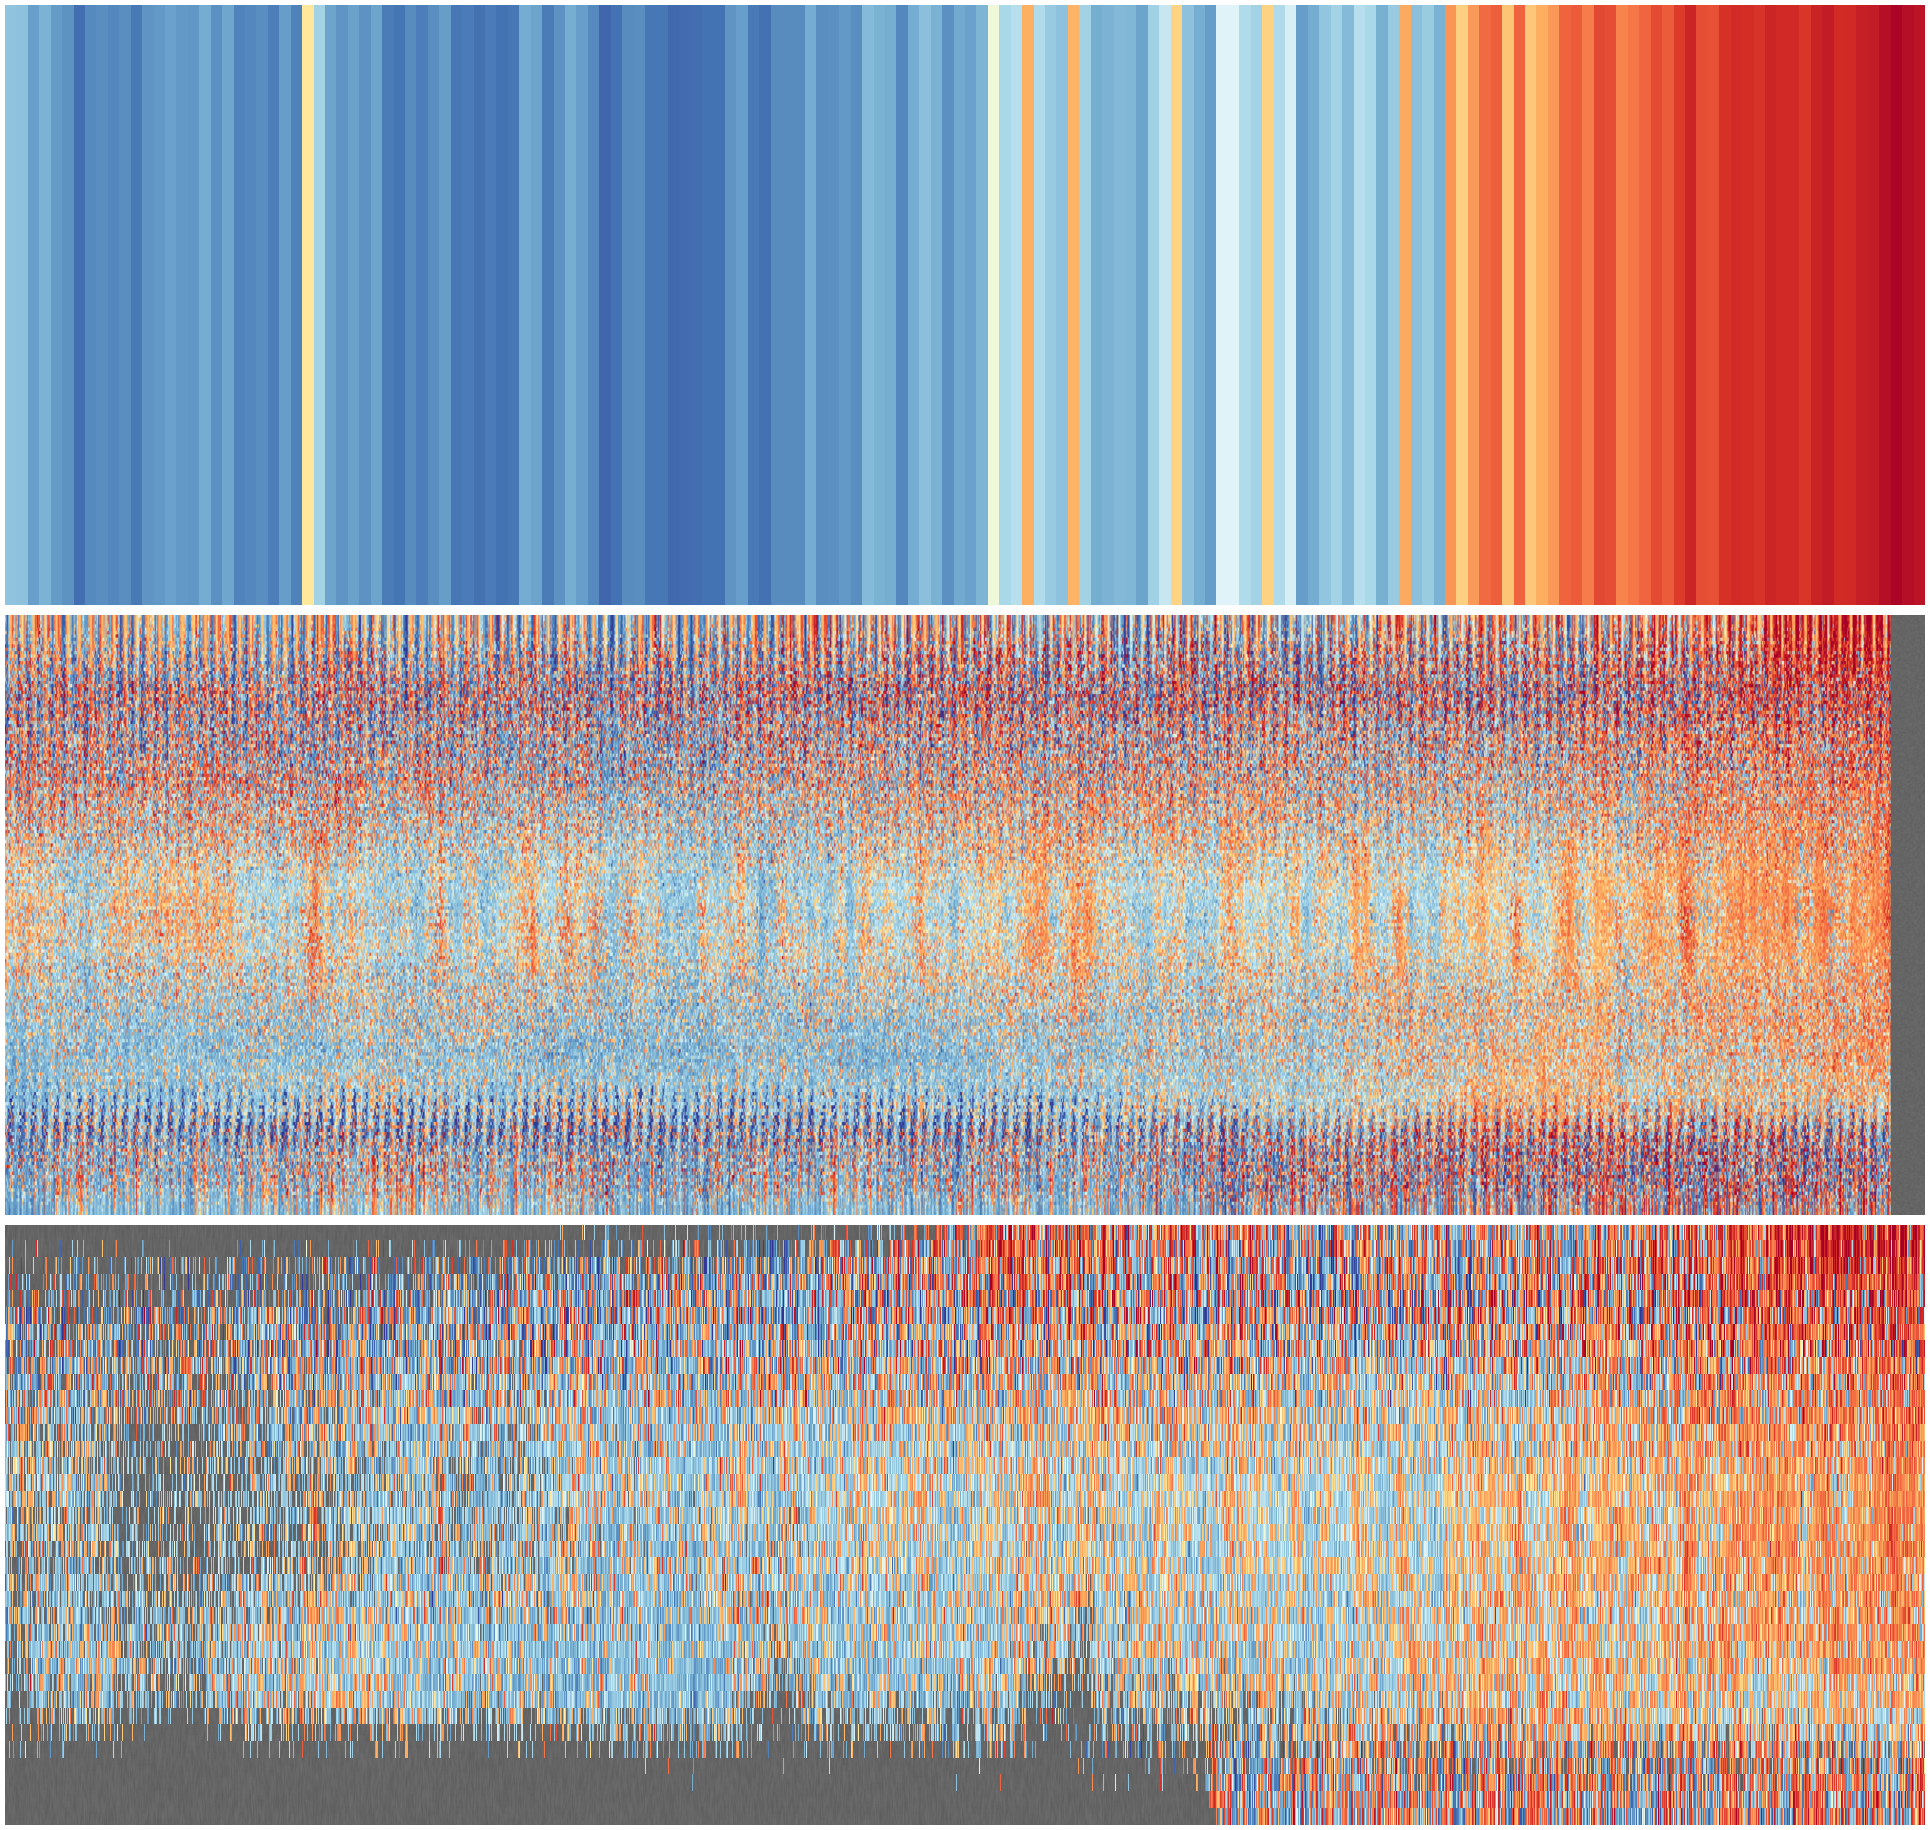
# Compare pre-calculated stripes from EUSTACE and HadCRUT5
# Add axes and a grid.
import os
import numpy
import datetime
import pickle
import matplotlib
from matplotlib.backends.backend_agg import FigureCanvasAgg as FigureCanvas
from matplotlib.figure import Figure
from matplotlib.lines import Line2D
start=datetime.datetime(1851,1,1,0,0)
end=datetime.datetime(2018,12,31,23,59)
fig=Figure(figsize=(19.2,13), # Width, Height (inches)
dpi=100,
facecolor=(0.5,0.5,0.5,1),
edgecolor=None,
linewidth=0.0,
frameon=False,
subplotpars=None,
tight_layout=None)
canvas=FigureCanvas(fig)
matplotlib.rc('image',aspect='auto')
def add_latline(ax,latitude):
latl = (latitude+90)/180
ax.add_line(Line2D([start.timestamp(),end.timestamp()],
[latl,latl],
linewidth=0.5,
color=(0.8,0.8,0.8,1),
zorder=200))
# HadCRUT5 at the top
# Add a textured grey background
s=(2000,600)
ax2 = fig.add_axes([0,0.67+0.03,1,0.32],facecolor='green')
ax2.set_axis_off() # Don't want surrounding x and y axis
nd2=numpy.random.rand(s[1],s[0])
clrs=[]
for shade in numpy.linspace(.42+.01,.36+.01):
clrs.append((shade,shade,shade,1))
y = numpy.linspace(0,1,s[1])
x = numpy.linspace(0,1,s[0])
img = ax2.pcolormesh(x,y,nd2,
cmap=matplotlib.colors.ListedColormap(clrs),
alpha=1.0,
shading='gouraud',
zorder=10)
# Plot the stripes
ax = fig.add_axes([0,0.67+0.03,1,0.32],facecolor='black',
xlim=((start+datetime.timedelta(days=1)).timestamp(),
(end-datetime.timedelta(days=1)).timestamp()),
ylim=(0,1))
ax.set_axis_off()
(ndata,dts) = pickle.load( open( "HadCRUT5.pkl", "rb" ) )
ndata = numpy.transpose(ndata)
s=ndata.shape
y = numpy.linspace(0,1,s[0]+1)
x = [(a-datetime.timedelta(days=15)).timestamp() for a in dts]
x.append((dts[-1]+datetime.timedelta(days=15)).timestamp())
img = ax.pcolorfast(x,y,numpy.cbrt(ndata),
cmap='RdYlBu_r',
alpha=1.0,
vmin=-1.7,
vmax=1.7,
zorder=100)
for lat in [-60,-30,0,30,60]:
add_latline(ax,lat)
# EUSTACE in the middle
# Add a textured grey background
s=(2000,600)
ax2 = fig.add_axes([0,0.335+0.03,1,0.32],facecolor='green')
ax2.set_axis_off() # Don't want surrounding x and y axis
nd2=numpy.random.rand(s[1],s[0])
clrs=[]
for shade in numpy.linspace(.42+.01,.36+.01):
clrs.append((shade,shade,shade,1))
y = numpy.linspace(0,1,s[1])
x = numpy.linspace(0,1,s[0])
img = ax2.pcolormesh(x,y,nd2,
cmap=matplotlib.colors.ListedColormap(clrs),
alpha=1.0,
shading='gouraud',
zorder=10)
# Plot the stripes
ax = fig.add_axes([0,0.335+0.03,1,0.32],facecolor='black',
xlim=((start+datetime.timedelta(days=1)).timestamp(),
(end-datetime.timedelta(days=1)).timestamp()),
ylim=(0,1))
ax.set_axis_off()
(ndata,dts) = pickle.load( open( "EUSTACE.pkl", "rb" ) )
ndata = numpy.transpose(ndata)
s=ndata.shape
y = numpy.linspace(0,1,s[0]+1)
x = [(a-datetime.timedelta(days=15)).timestamp() for a in dts]
x.append((dts[-1]+datetime.timedelta(days=15)).timestamp())
img = ax.pcolorfast(x,y,numpy.cbrt(ndata),
cmap='RdYlBu_r',
alpha=1.0,
vmin=-1.7,
vmax=1.7,
zorder=100)
for lat in [-60,-30,0,30,60]:
add_latline(ax,lat)
# Difference at the bottom
# Add a textured grey background
s=(2000,600)
ax2 = fig.add_axes([0,0.03,1,0.32],facecolor='green')
ax2.set_axis_off() # Don't want surrounding x and y axis
nd2=numpy.random.rand(s[1],s[0])
clrs=[]
for shade in numpy.linspace(.42+.01,.36+.01):
clrs.append((shade,shade,shade,1))
y = numpy.linspace(0,1,s[1])
x = numpy.linspace(0,1,s[0])
img = ax2.pcolormesh(x,y,nd2,
cmap=matplotlib.colors.ListedColormap(clrs),
alpha=1.0,
shading='gouraud',
zorder=10)
# Plot the stripes
ax = fig.add_axes([0,0.03,1,0.32],facecolor='black',
xlim=((start+datetime.timedelta(days=1)).timestamp(),
(end-datetime.timedelta(days=1)).timestamp()),
ylim=(0,1))
ax.set_axis_off()
(ndata,dts) = pickle.load( open( "comparison.pkl", "rb" ) )
ndata = numpy.transpose(ndata)
s=ndata.shape
y = numpy.linspace(0,1,s[0]+1)
x = [(a-datetime.timedelta(days=15)).timestamp() for a in dts]
x.append((dts[-1]+datetime.timedelta(days=15)).timestamp())
img = ax.pcolorfast(x,y,numpy.cbrt(ndata),
cmap='RdYlBu_r',
alpha=1.0,
vmin=-1.7,
vmax=1.7,
zorder=100)
for lat in [-60,-30,0,30,60]:
add_latline(ax,lat)
# Add a date grid
axg = fig.add_axes([0,0,1,1],facecolor='green',
xlim=((start+datetime.timedelta(days=1)).timestamp(),
(end-datetime.timedelta(days=1)).timestamp()),
ylim=(0,1))
axg.set_axis_off()
def add_dateline(ax,year):
x = datetime.datetime(year,1,1,0,0).timestamp()
ax.add_line(Line2D([x,x], [0.02,1.0],
linewidth=0.5,
color=(0.8,0.8,0.8,1),
zorder=200))
ax.text(x,0.015,
"%04d" % year,
horizontalalignment='center',
verticalalignment='center',
color='black',
size=14,
clip_on=True,
zorder=200)
for year in range(1860,2020,10):
add_dateline(axg,year)
fig.savefig('comparison_grid.png')