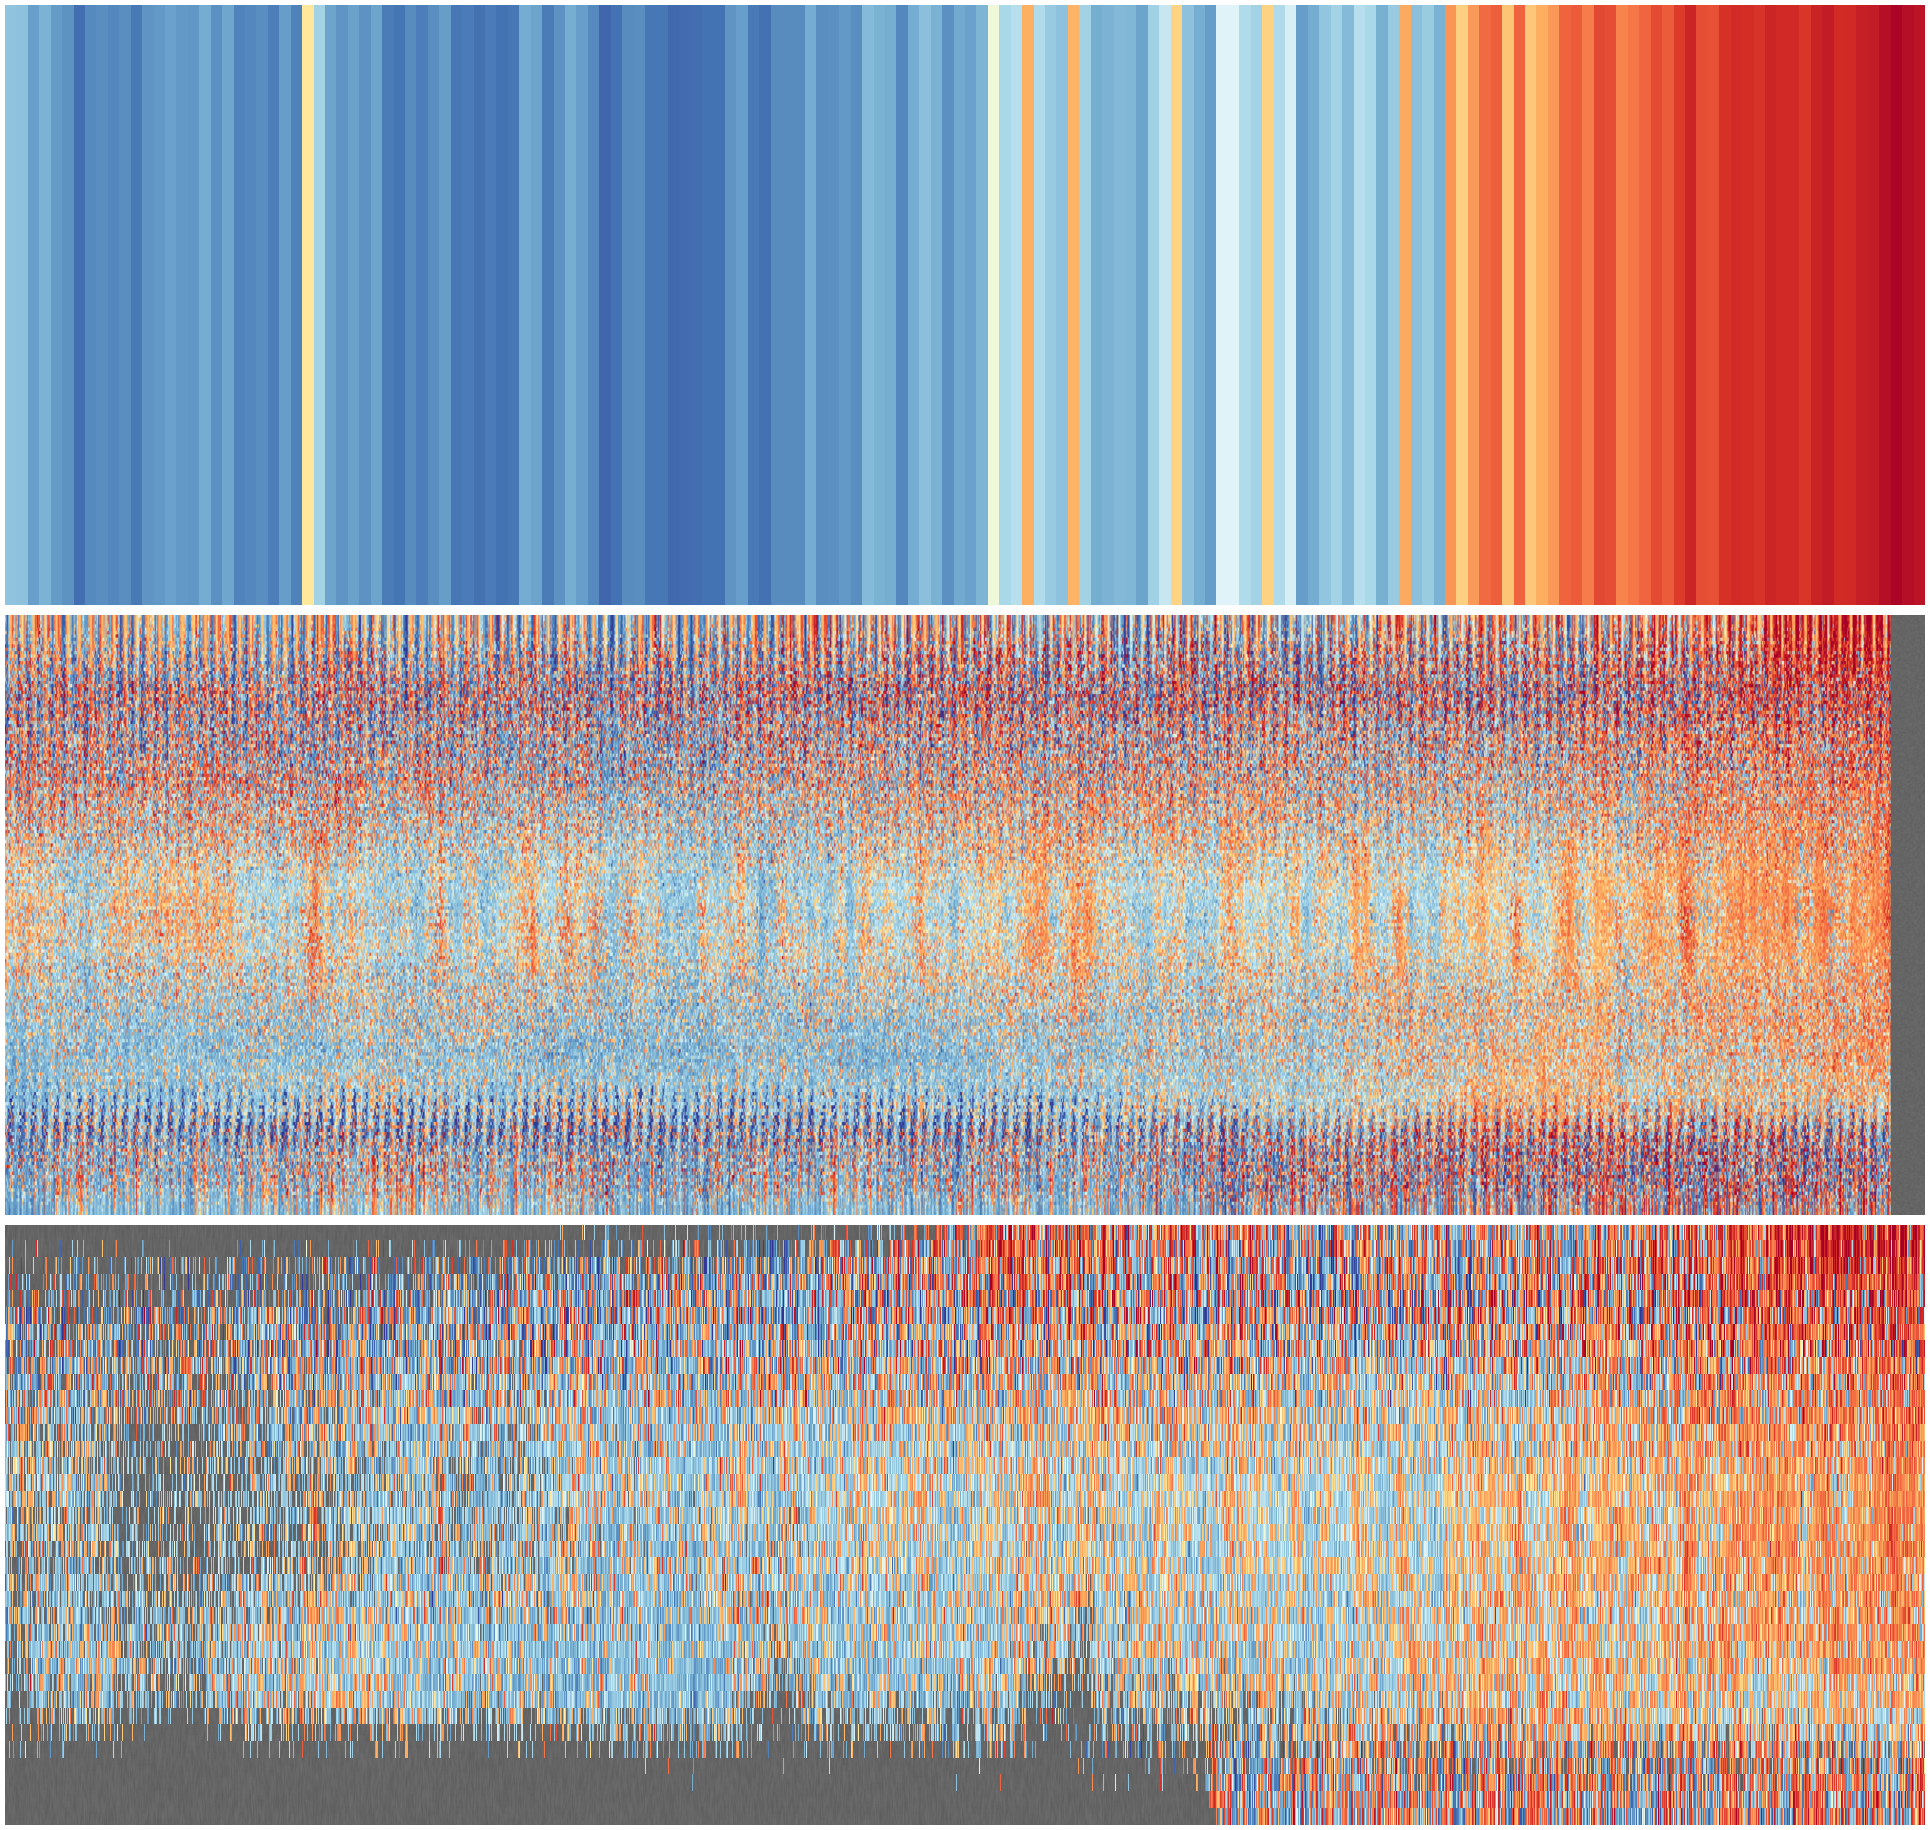
HadCRUT5: Ensemble sampled at high resolution
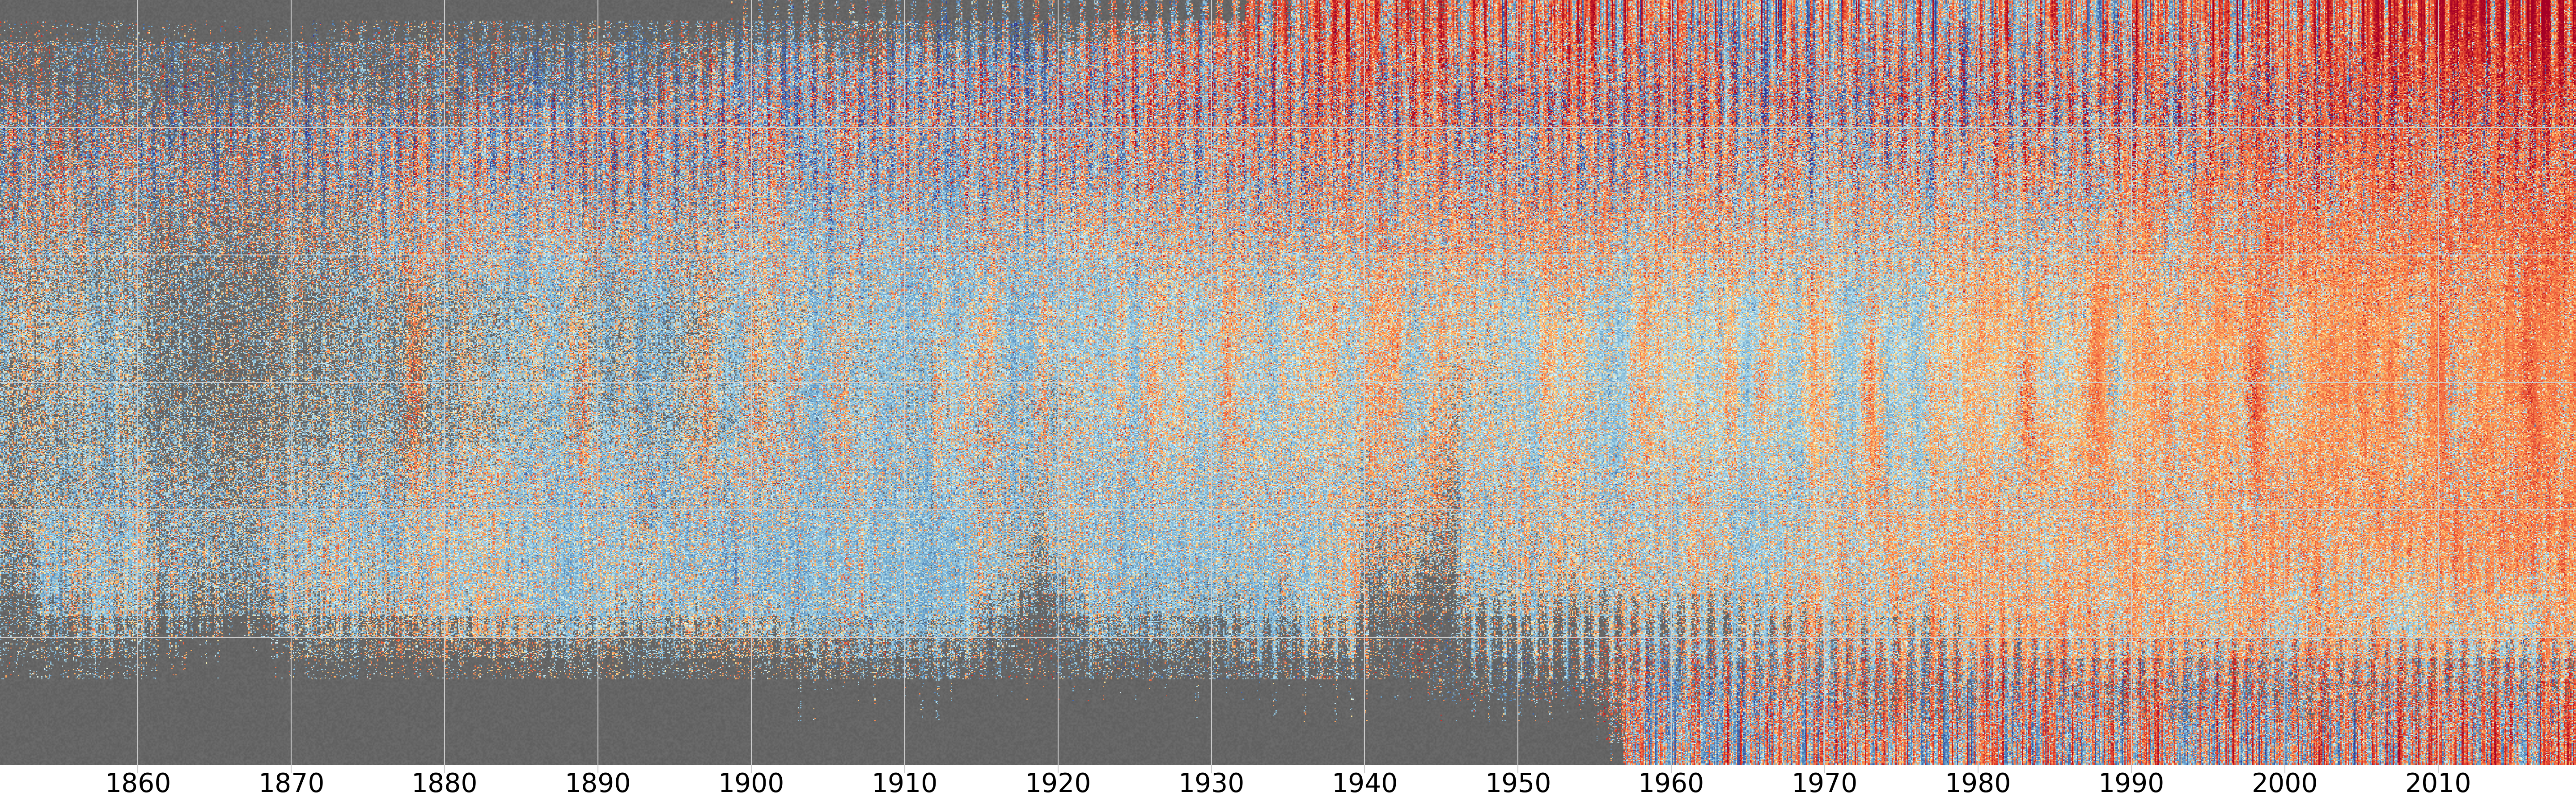
Monthly temperature anomalies (w.r.t. 1961-90) from the HadCRUT5 dataset after regridding to a 0.5 degree spatial resolution. The vertical axis is latitude (south pole at the bottom, north pole at the top), and each pixel is from a randomly selected longitude and ensemble member. Grey areas show regions where HadCRUT5 has no data.
HadCRUT5 has 100 ensemble members, to speed things up the sample here is drawn from only 10 of them. The ensemble members are not all the same, so we should not choose 10 members at random. The best sample will have equal representation from even and odd numbered members (differences in treatment of urbanisation) and from the first 50 and last 50 members (differences in marine bias adjustment). I used members 1, 2, 3, 4, 5, 56, 57, 58, 59, and 60.