#!/usr/bin/env python
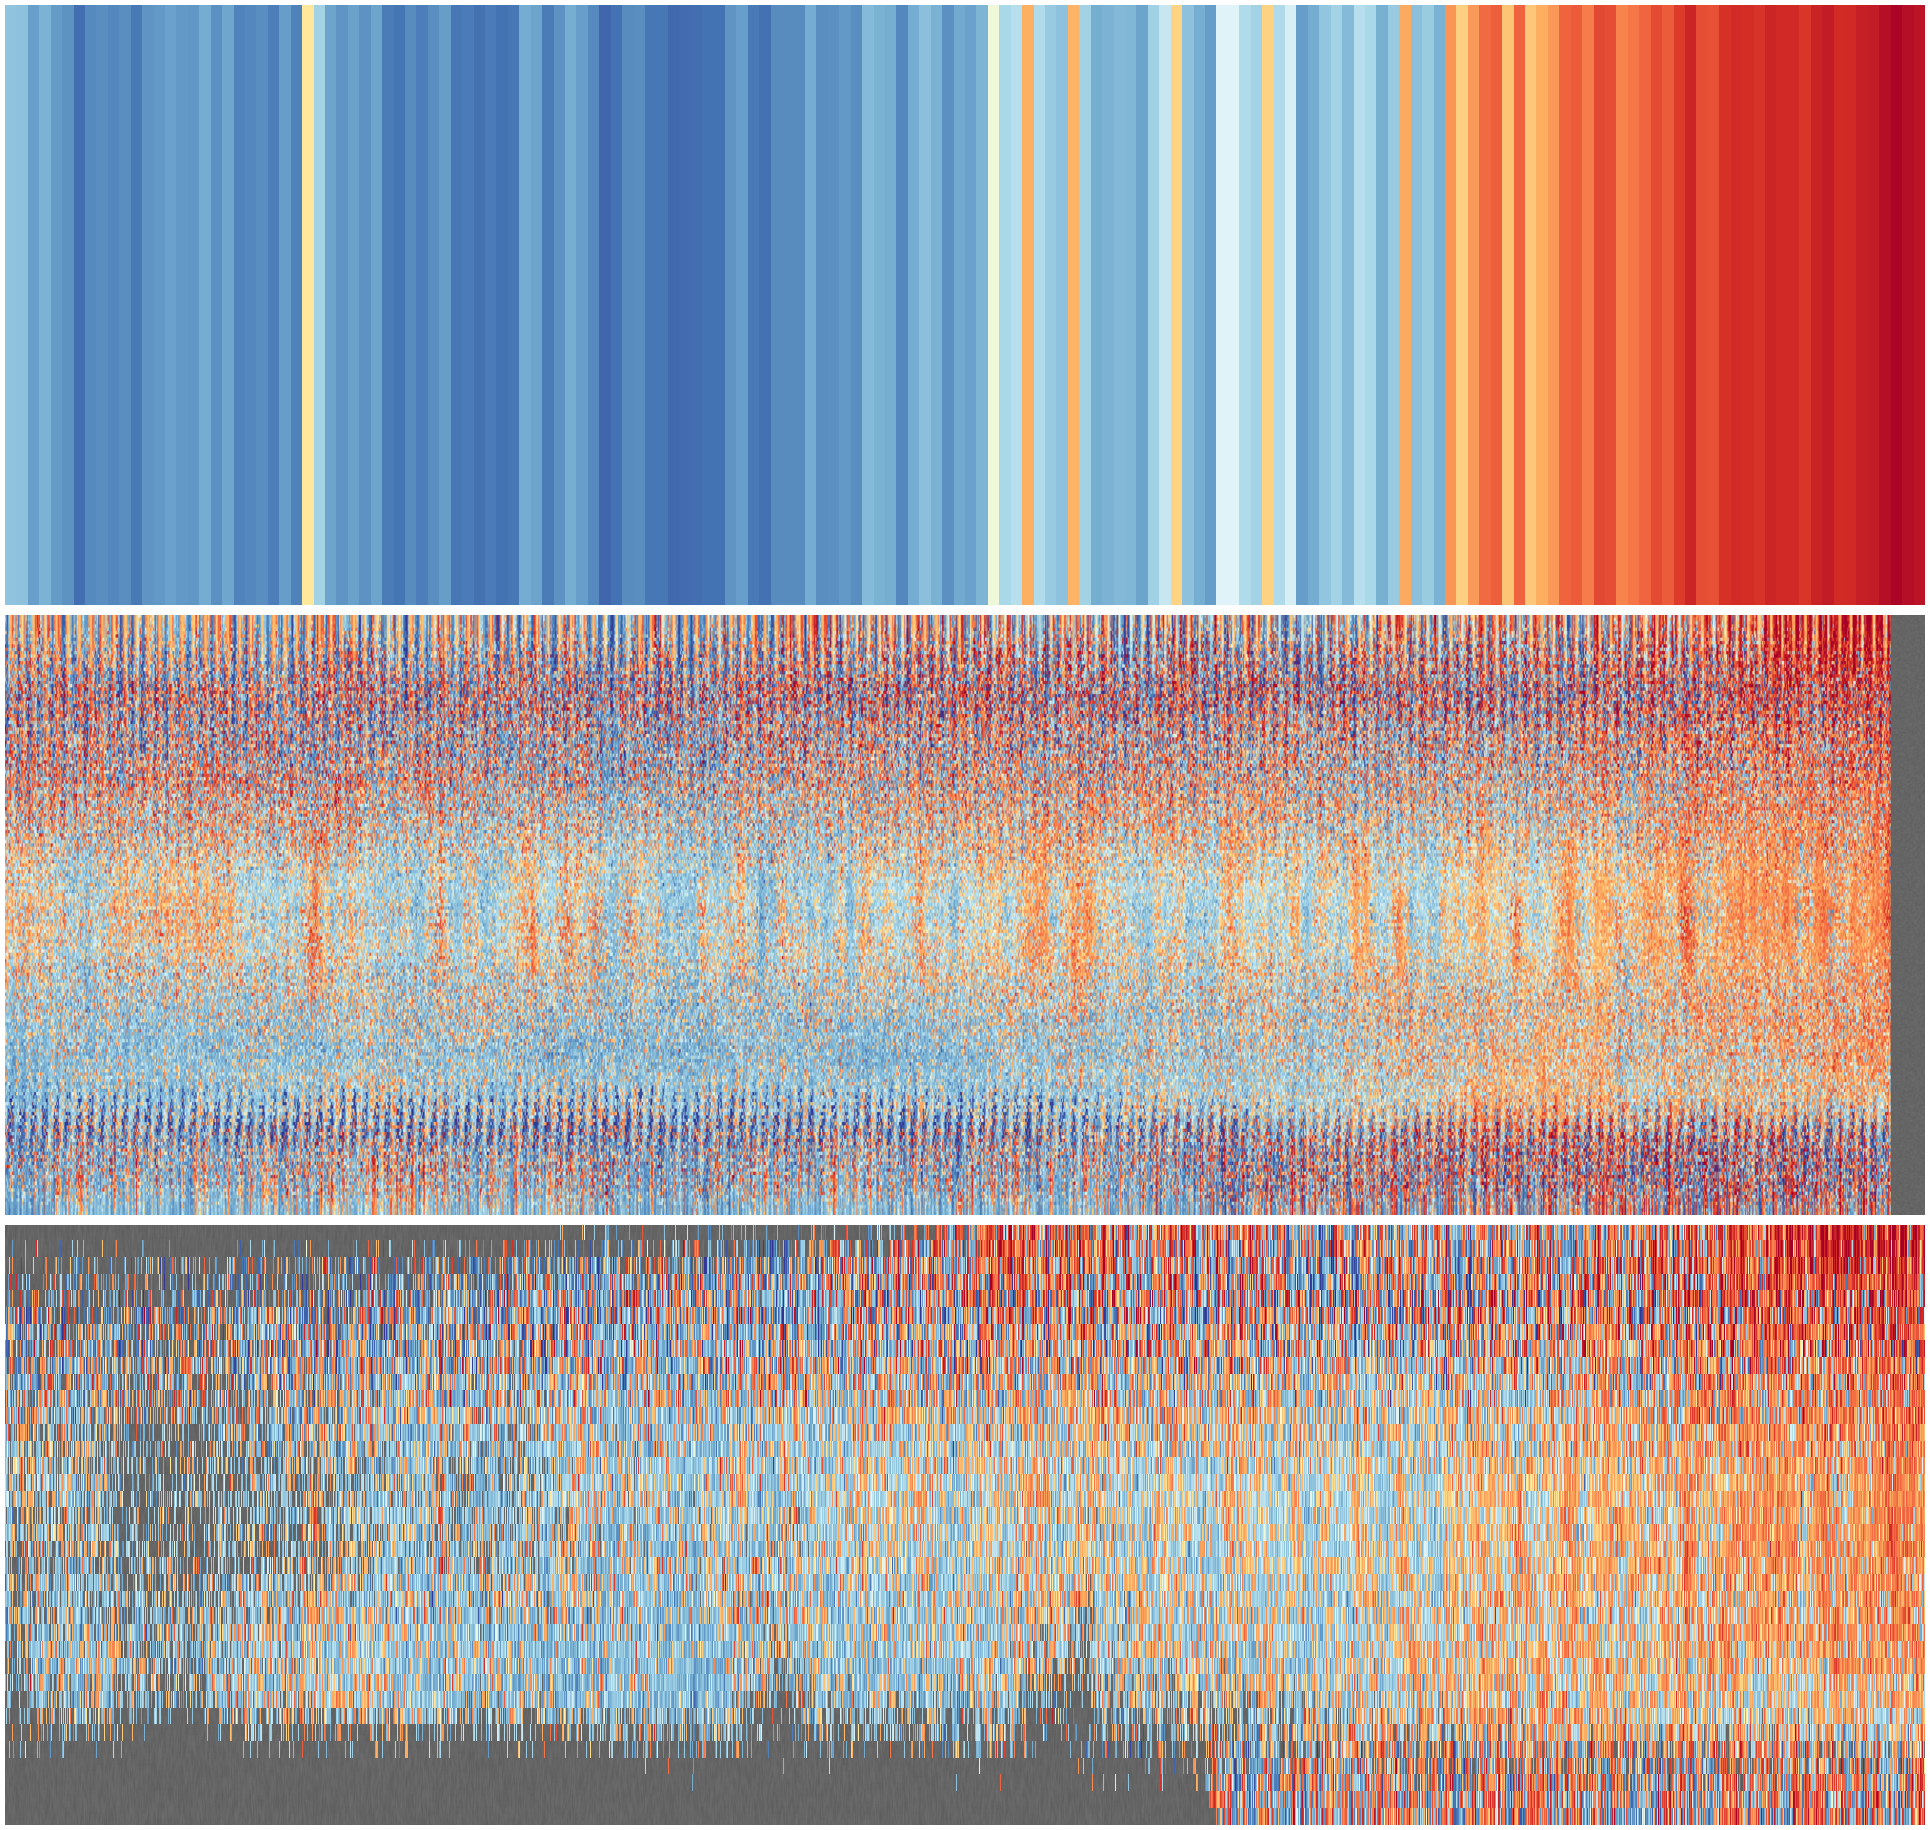
# Make a climate-stripes image from HadCRUT5
# Basic version, global-mean-annual-mean, one ensemble member.
import os
import iris
import iris.coord_categorisation
import numpy
import datetime
import matplotlib
from matplotlib.backends.backend_agg import FigureCanvasAgg as FigureCanvas
from matplotlib.figure import Figure
from matplotlib.patches import Rectangle
start=datetime.datetime(1851,1,1,0,0)
end=datetime.datetime(2018,12,31,23,59)
from get_sample import get_sample_cube
(ndata,dts) = get_sample_cube(start,end)
# Plot the resulting array as a 2d colourmap
fig=Figure(figsize=(16,4.5), # Width, Height (inches)
dpi=200,
facecolor=(0.5,0.5,0.5,1),
edgecolor=None,
linewidth=0.0,
frameon=False,
subplotpars=None,
tight_layout=None)
canvas=FigureCanvas(fig)
matplotlib.rc('image',aspect='auto')
# Add a textured grey background
s=(2000,100)
ax2 = fig.add_axes([0,0,1,1],facecolor='green')
ax2.set_axis_off() # Don't want surrounding x and y axis
nd2=numpy.random.rand(s[1],s[0])
clrs=[]
for shade in numpy.linspace(.42+.01,.36+.01):
clrs.append((shade,shade,shade,1))
y = numpy.linspace(0,1,s[1])
x = numpy.linspace(0,1,s[0])
img = ax2.pcolormesh(x,y,nd2,
cmap=matplotlib.colors.ListedColormap(clrs),
alpha=1.0,
shading='gouraud',
zorder=10)
# Plot the stripes
ax = fig.add_axes([0,0,1,1],facecolor='black',
xlim=((start+datetime.timedelta(days=183)).timestamp(),
(end-datetime.timedelta(days=183)).timestamp()),
ylim=(0,1))
ax.set_axis_off()
nd2=numpy.reshape(ndata,(ndata.shape[0],1))
nd3=numpy.concatenate((nd2,nd2),1)
nd3 = numpy.transpose(nd3)
y = (0,1)
x = [a.timestamp() for a in dts]
img = ax.pcolorfast(x,y,numpy.cbrt(nd3),
cmap='RdYlBu_r',
alpha=1.0,
vmin=-1.0,
vmax=1.0,
zorder=100)
fig.savefig('HadCRUT5.png')