20CRv3 monthly ensemble mean
The Twentieth Century Reanalysis, version 3, provides ideal data for this sort of study: an 80-member ensemble, at about 0.25 degree resolution, every 3-hours back to 1836. Unfortunately, that’s a 5Tb download, and the data is stored on tape in the US, so downloading is slow - getting it all would take weeks at best.
So instead I’m using the pre-processed data they helpfully provide. The monthly averages of the ensemble mean at 1-degree resolution. No ensemble - but exponentially more accessible.
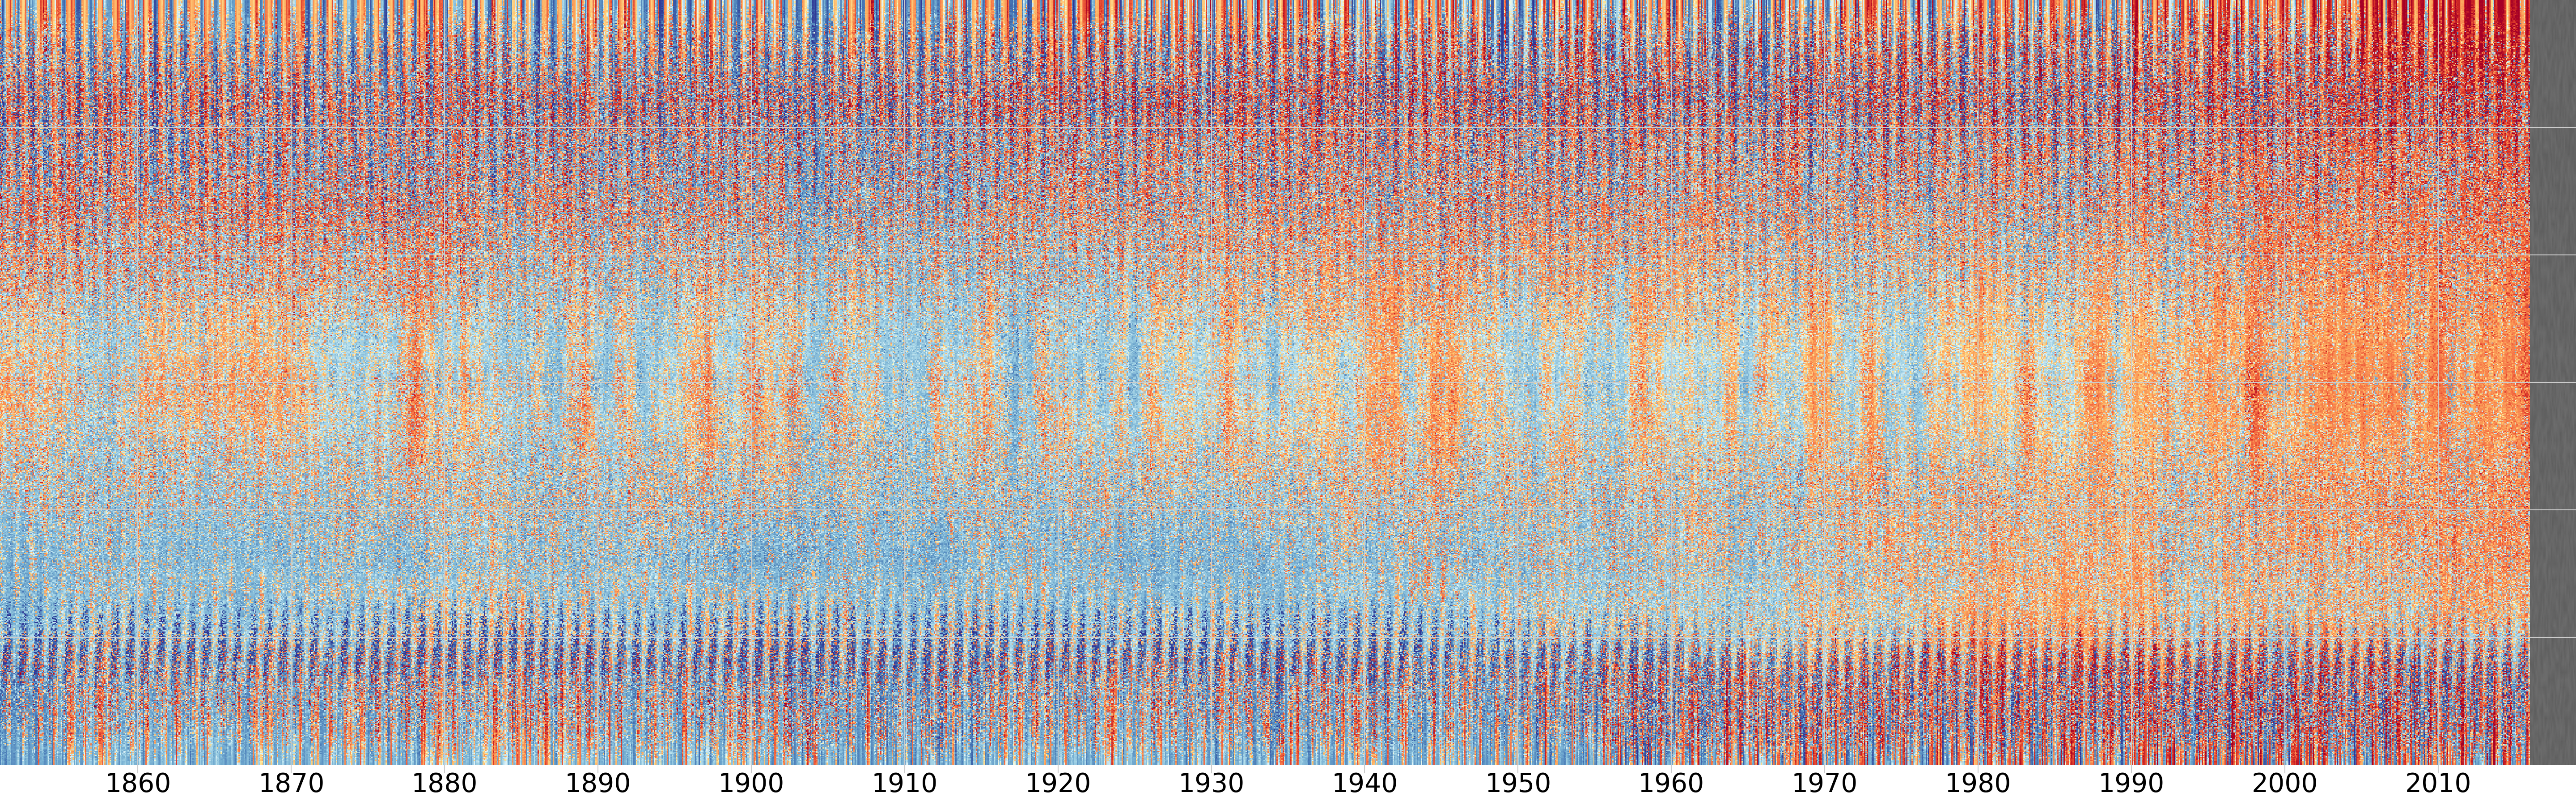
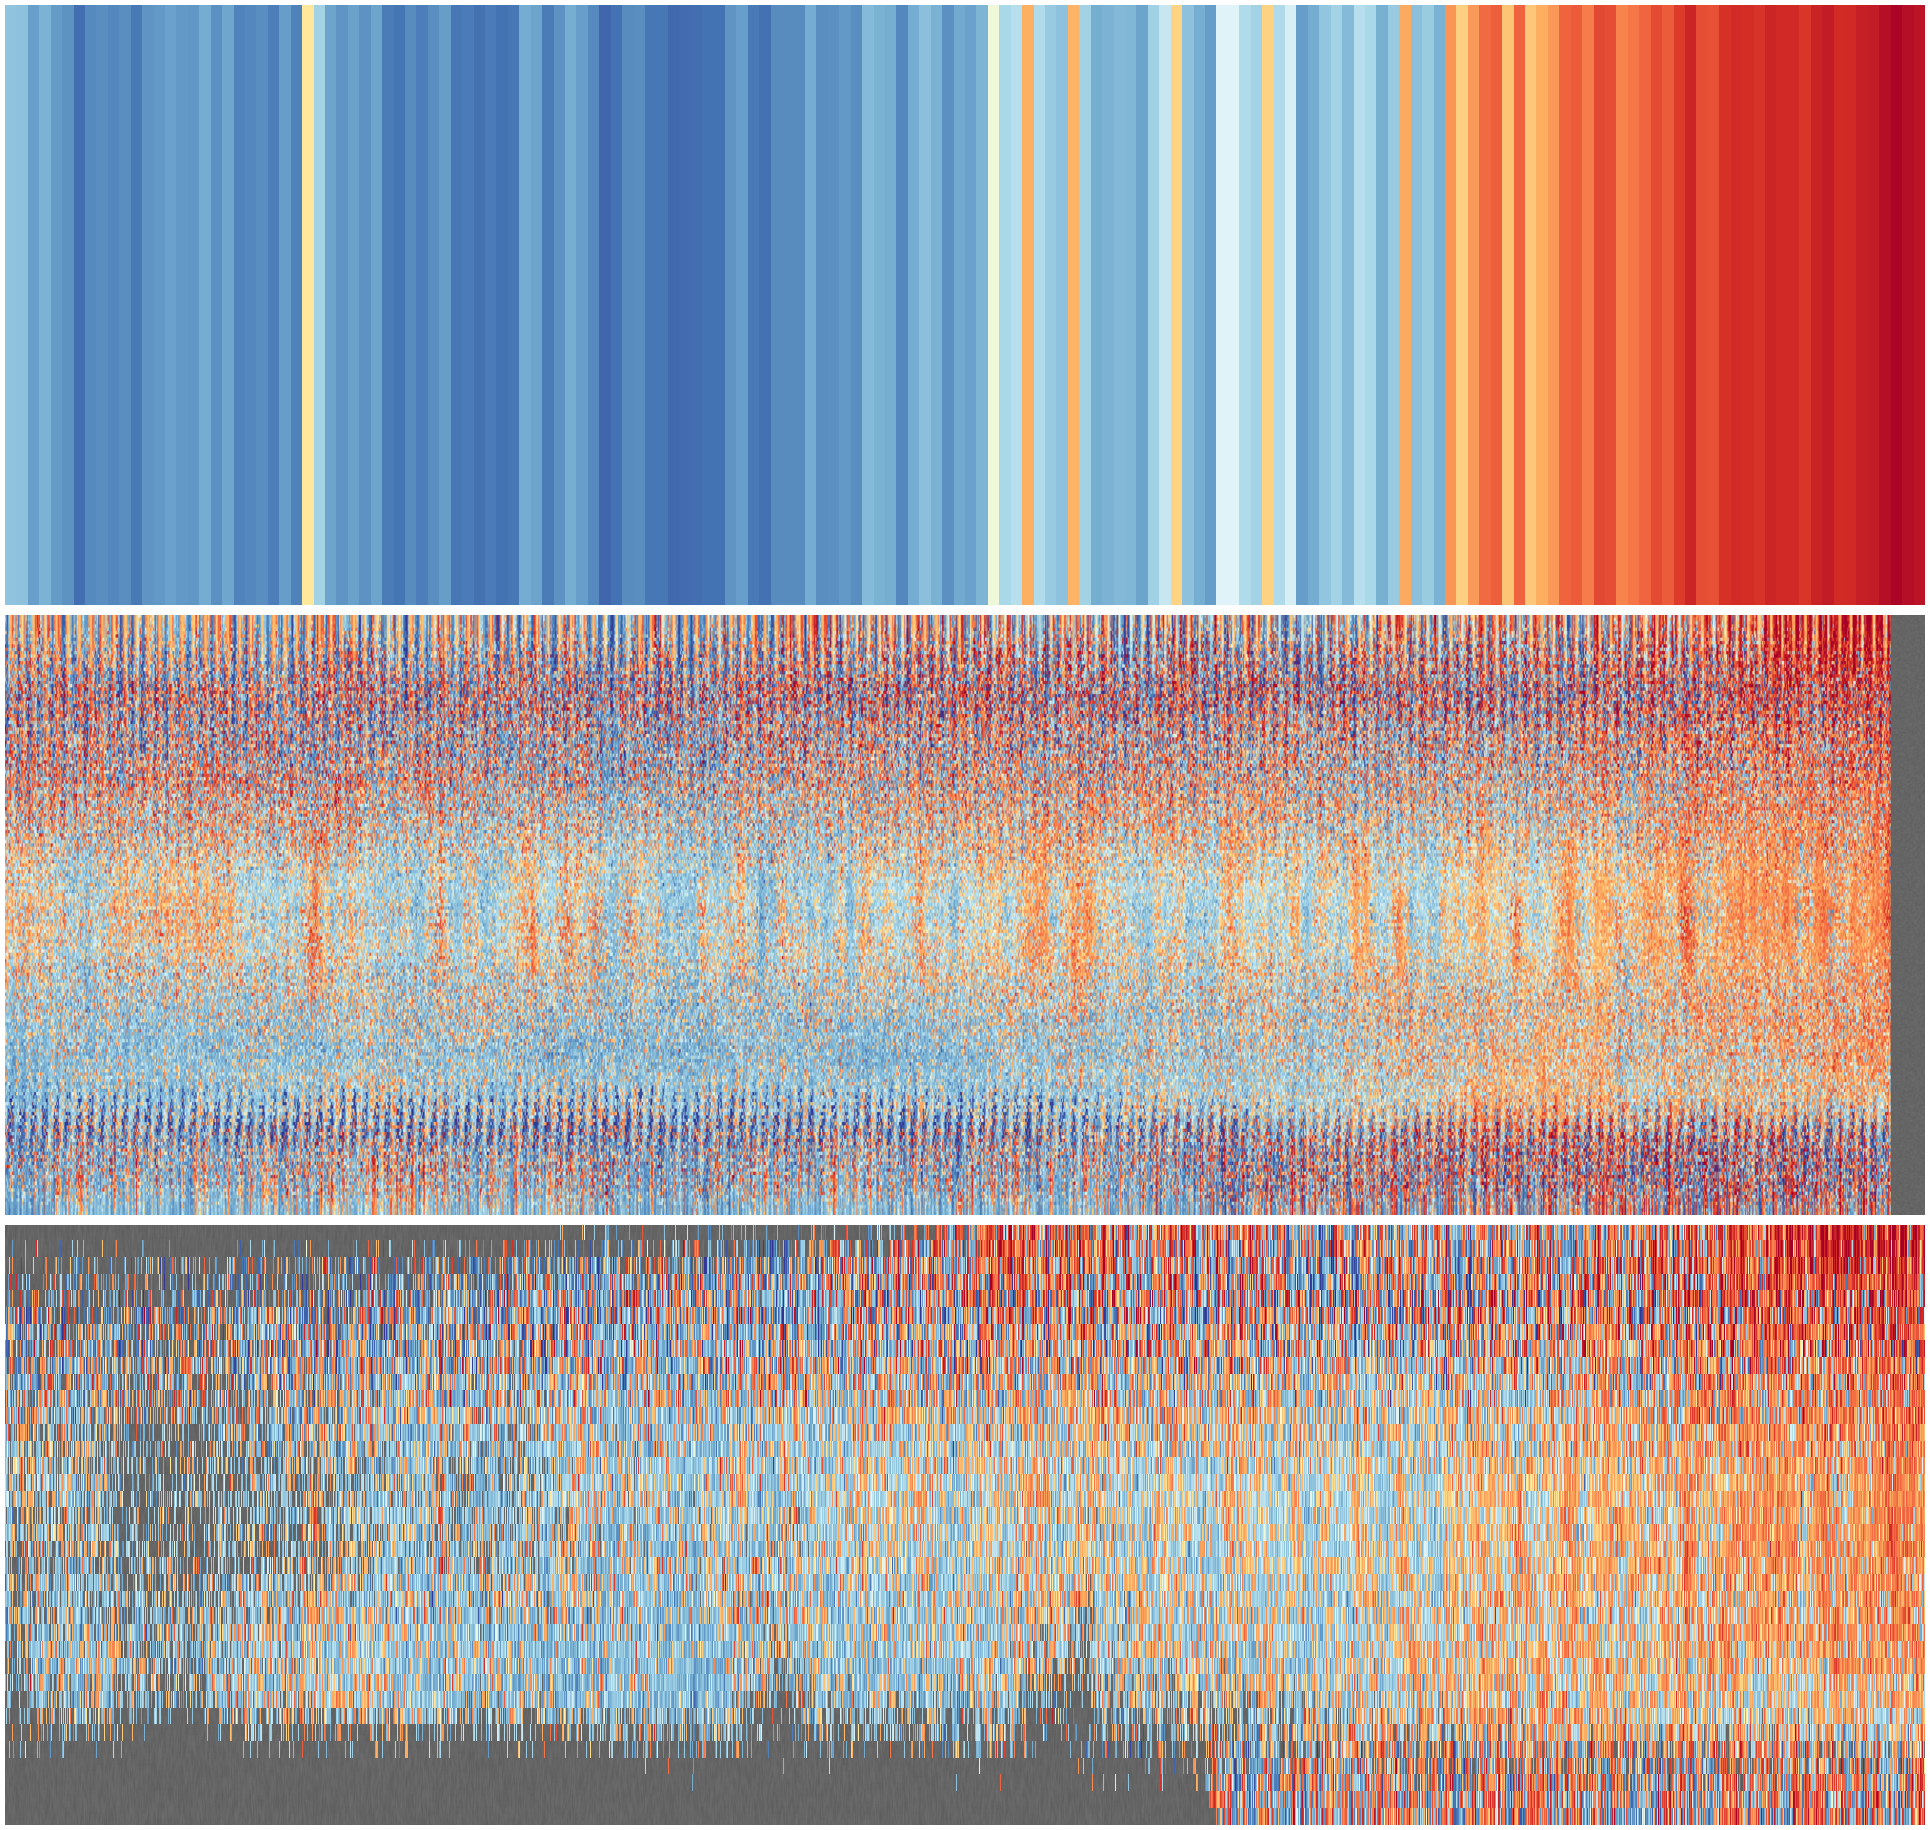
Monthly 2m-temperature anomalies (w.r.t. 1961-90) from the 20CRv3 ensemble mean (regridded to a 0.1 degree resolution. The vertical axis is latitude (south pole at the bottom, north pole at the top), and each pixel is from a randomly selected longitude.