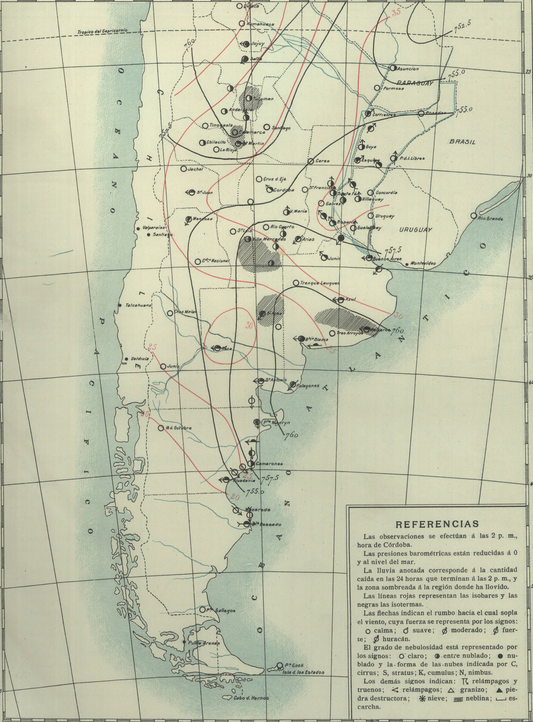
Argentine Daily Weather Reports 1902: Station locations
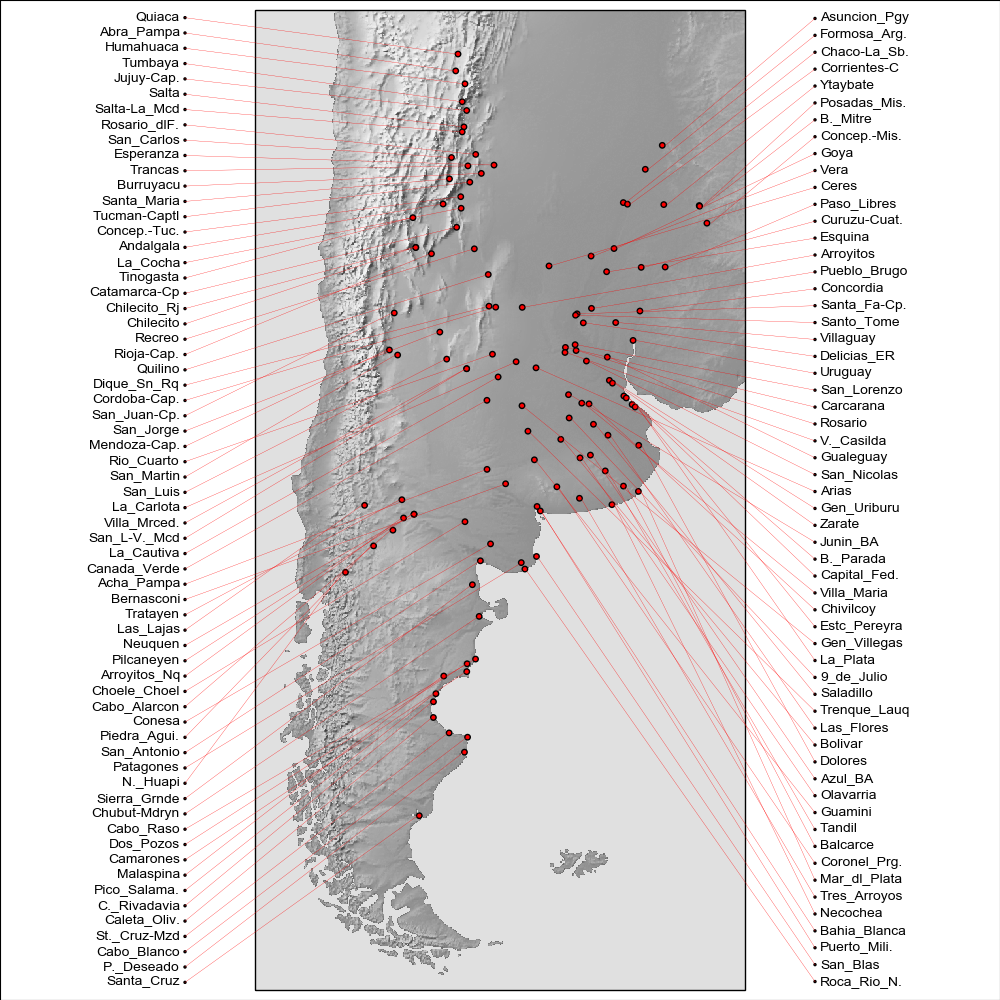
Latitude and Longitude estimated for each station. Note that these are crudely geolocated, mostly using Google. They have low precision and low confidence. Heights have not been estimated.
SEF_ID,                 lat,            lon,            height
DWR_9_de_Julio,         -35.4439,       -60.8846,       NA
DWR_Abra_Pampa,         -22.7227,       -65.6970,       NA
DWR_Andalgala,          -27.6,          -66.316667,     NA
DWR_Arias,              -33.633333,     -62.416667,     NA
DWR_Arroyitos,          -31.4192,       -63.0509,       NA
DWR_Bahia_Blanca,       -38.725151,     -62.254951,     NA
DWR_Balcarce,           -37.84702,      -58.25407,      NA
DWR_Bernasconi,         -37.90406,      -63.73868,      NA
DWR_B._Mitre,           -27.3833,       -55.8833,       NA
DWR_Bolivar,            -36.2383,       -61.2336,       NA
DWR_B._Parada,          -34.5430,       -58.4868,       NA
DWR_Azul_BA,            -36.7750,       -59.8540,       NA
DWR_Junin_BA,           -34.5885,       -60.9496,       NA
DWR_Burruyacu,          -26.5,          -64.75,         NA
DWR_Cabo_Alarcon,       -39.5,          -69.1,          NA
DWR_Cabo_Blanco,        -47.202,        -65.7333,       NA
DWR_Cabo_Raso,          -44.3372,       -65.2492,       NA
DWR_Caleta_Oliv.,       -46.4426,       -67.5172,       NA
DWR_Camarones,          -44.79332,      -65.710808,     NA
DWR_Canada_Verde,       -34.8363,       -64.5833,       NA
DWR_Capital_Fed.,       -34.60903,      -58.37322,      NA
DWR_Carcarana,          -32.85744,      -61.15189,      NA
DWR_Catamarca-Cp,       -28.466667,     -65.783333,     NA
DWR_Ceres,              -29.8817,       -61.9461,       NA
DWR_Chaco-La_Sb.,       -27.451389,     -58.986667,     NA
DWR_Chilecito,          -29.166667,     -67.5,          NA
DWR_Chivilcoy,          -34.8970,       -60.0191,       NA
DWR_Choele_Choel,       -39.28573,      -65.66189,      NA
DWR_Chubut-Mdryn,       -42.77151,      -65.04027,      NA
DWR_Concep.-Mis.,       -27.9806,       -55.5217,       NA
DWR_Concep.-Tuc.,       -27.3459,       -65.5927,       NA
DWR_Concordia,          -31.391041,     -58.019569,     NA
DWR_Conesa,             -40.1112,       -64.45421,      NA
DWR_Cordoba-Cap.,       -31.416667,     -64.183333,     NA
DWR_Coronel_Prg.,       -37.9853,       -61.3498,       NA
DWR_Corrientes-C,       -27.501921,     -58.812889,     NA
DWR_C._Rivadavia,       -45.864722,     -67.480833,     NA
DWR_Curuzu-Cuat.,       -29.7868,       -58.08739,      NA
DWR_Dique_Sn_Rq,        -31.378056,     -64.469444,     NA
DWR_Dolores,            -36.3152,       -57.6753,       NA
DWR_Dos_Pozos,          -44.5047,       -65.6836,       NA
DWR_Delicias_ER,        -31.9333,       -60.4167,       NA
DWR_Esperanza,          -26.19614,      -64.239014,     NA
DWR_Esquina,            -30.018749,     -59.524052,     NA
DWR_Estc_Pereyra,       -34.8364,       -58.0946,       NA
DWR_Formosa_Arg.,       -26.183333,     -58.183333,     NA
DWR_Gen_Uriburu,        -34.00,         -59.166667,     NA
DWR_Gen_Villegas,       -35.0326,       -63.0148,       NA
DWR_Goya,               -29.15477,      -59.264938,     NA
DWR_Gualeguay,          -33.14972,      -59.31069,      NA
DWR_Guamini,            -37.0126,       -62.4185,       NA
DWR_Humahuaca,          -23.2040,       -65.3486,       NA
DWR_Jujuy-Cap.,         -24.183333,     -65.3,          NA
DWR_La_Carlota,         -33.417936,     -63.293495,     NA
DWR_La_Cautiva,         -33.97993,      -64.08282,      NA
DWR_La_Cocha,           -27.77,         -65.585833,     NA
DWR_La_Plata,           -34.9205,       -57.9536,       NA
DWR_Las_Flores,         -36.0142,       -59.0993,       NA
DWR_Las_Lajas,          -38.5239,       -70.3640,       NA
DWR_Malaspina,          -44.9333,       -66.9,          NA
DWR_Mar_dl_Plata,       -38.0055,       -57.5426,       NA
DWR_Mendoza-Cap.,       -32.883333,     -68.816667,     NA
DWR_Posadas_Mis.,       -27.3621,       -55.9009,       NA
DWR_Necochea,           -38.5545,       -58.7396,       NA
DWR_Arroyitos_Nq,       -39.0733,       -68.5650,       NA
DWR_Neuquen,            -38.9517,       -68.0592,       NA
DWR_Pilcaneyen,         -38.9525,       -68.064167,     NA
DWR_N._Huapi,           -40.9256,       -71.5151,       NA
DWR_Olavarria,          -36.8937,       -60.3233,       NA
DWR_Asuncion_Pgy,       -25.2637,       -57.5759,       NA
DWR_Acha_Pampa,         -37.37311,      -64.59974,      NA
DWR_Paso_Libres,        -29.71423,      -57.08752,      NA
DWR_Patagones,          -40.79547,      -62.96865,      NA
DWR_P._Deseado,         -47.75,         -65.916667,     NA
DWR_Pico_Salama.,       -45.5733,       -67.3372,       NA
DWR_Piedra_Agui.,       -40.033333,     -70.066667,     NA
DWR_Pueblo_Brugo,       -31.38794,      -60.092,        NA
DWR_Puerto_Mili.,       -38.886944,     -62.097778,     NA
DWR_Quiaca,             -22.1044,       -65.5968,       NA
DWR_Quilino,            -30.21612,      -64.49441,      NA
DWR_Recreo,             -29.266667,     -65.066667,     NA
DWR_Rio_Cuarto,         -33.142971,     -64.329277,     NA
DWR_Rioja-Cap.,         -29.4125,       -66.854167,     NA
DWR_Chilecito_Rj,       -29.1611,       -67.4962,       NA
DWR_Roca_Rio_N.,        -41.030556,     -62.789722,     NA
DWR_Rosario,            -32.95924,      -60.683479,     NA
DWR_Rosario_dlF.,       -25.8,          -64.966667,     NA
DWR_Saladillo,          -35.6389,       -59.7795,       NA
DWR_Salta,              -24.783333,     -65.416667,     NA
DWR_Salta-La_Mcd,       -24.9667,       -65.4895,       NA
DWR_San_Antonio,        -40.73,         -64.95,        NA
DWR_San_Blas,           -40.5608,       -62.2367,       NA
DWR_San_Carlos,         -25.9,          -65.933333,     NA
DWR_San_Jorge,          -32.3,          -66.6,          NA
DWR_San_Juan-Cp.,       -31.534167,     -68.526111,     NA
DWR_San_Lorenzo,        -32.74582,      -60.73433,      NA
DWR_San_Luis,           -33.3,          -66.333333,     NA
DWR_San_L-V._Mcd,       -33.667,        -65.467,        NA
DWR_San_Martin,         -33.083,        -68.47,         NA
DWR_San_Nicolas,        -33.33037,      -60.21449,      NA
DWR_Santa_Cruz,         -50.0247,       -68.5244,       NA
DWR_Santa_Fa-Cp.,       -31.610659,     -60.697292,     NA
DWR_Santa_Maria,        -26.683333,     -66.033333,     NA
DWR_Santo_Tome,         -31.6622,       -60.7616,       NA
DWR_Sierra_Grnde,       -41.60447,      -65.35436,      NA
DWR_St._Cruz-Mzd,       -47.028611,     -66.711944,     NA
DWR_Tandil,             -37.3288,       -59.1367,       NA
DWR_Tinogasta,          -28.066667,     -67.566667,     NA
DWR_Trancas,            -26.217222,     -65.283056,     NA
DWR_Tratayen,           -38.4,          -68.6,          NA
DWR_Trenque_Lauq,       -35.96544,      -62.73348,      NA
DWR_Tres_Arroyos,       -38.3775,       -60.2752,       NA
DWR_Tucman-Captl,       -26.816667,     -65.216667,     NA
DWR_Tumbaya,            -23.8577,       -65.4676,       NA
DWR_Uruguay,            -32.48465,      -58.23293,      NA
DWR_V._Casilda,         -33.0445,       -61.1650,       NA
DWR_Vera,               -29.47028,      -60.20232,      NA
DWR_Villaguay,          -31.86728,      -59.02684,      NA
DWR_Villa_Maria,        -34.88247,      -60.34444,      NA
DWR_Villa_Mrced.,       -33.666667,     -65.466667,     NA
DWR_Ytaybate,           -27.43,         -57.34,         NA
DWR_Zarate,             -34.0958,       -59.0242,       NA
Code to make the plot
#!/usr/bin/env python

# Plot and label the Argentinian DWR stations

import os
import pandas
import numpy

import matplotlib
from matplotlib.backends.backend_agg import \
             FigureCanvasAgg as FigureCanvas
from matplotlib.figure import Figure
from matplotlib.patches import Circle

import cartopy
import cartopy.crs as ccrs

# Find the directory with this script in
try:
    bindir=os.path.abspath(os.path.dirname(__file__))
except NameError:
    bindir='.'

fig=Figure(figsize=(10,10),  # Width, Height (inches)
           dpi=100,
           facecolor=(0.88,0.88,0.88,1),
           edgecolor=None,
           linewidth=0.0,
           frameon=False,
           subplotpars=None,
           tight_layout=None)
canvas=FigureCanvas(fig)
font = {'family' : 'sans-serif',
        'sans-serif' : 'Arial',
        'weight' : 'normal',
        'size'   : 16}
matplotlib.rc('font', **font)

# Argentina-centred projection
projection=ccrs.RotatedPole(pole_longitude=116, pole_latitude=128.5)
scale=9
extent=[scale*-1,scale,scale*-2,scale*2]

# Map in the centre
ax_map=fig.add_axes([0.25,0.01,0.5,0.98],projection=projection)
ax_map.set_axis_off()
ax_map.set_extent(extent, crs=projection)
ax_map.background_patch.set_facecolor((0.88,0.88,0.88,1))
land_img=ax_map.background_img(name='GreyT', resolution='low')

#Full axis for station names and linking lines
ax_full=fig.add_axes([0,0,1,1])
ax_full.patch.set_alpha(0.0)

# Load the station locations
stations=pandas.read_csv("%s/../raw_data/Positions.csv" % bindir,
                              skipinitialspace=True,quotechar="'")
# Rotate the lats and lons into projection
rp=ax_map.projection.transform_points(ccrs.PlateCarree(),
                                  stations['lon'].values,
                                  stations['lat'].values)
stations['lon']=rp[:,0]
stations['lat']=rp[:,1]

def pos_map_in_full(lat,lon):

    result={}
    aspect=2
    result['x']=0.25+0.5*((lon-(scale*-1))/(scale*2))
    result['y']=0.01+0.98*((lat-(scale*aspect*-1))/
                                       (scale*2*aspect))
    return result

# Get the left-hand half
lon_split=numpy.mean(stations['lon'])
left=stations[stations['lon']<=lon_split]
left=left.sort_values('lat',ascending=False)
i=0.0
for index, row in left.iterrows():
    ax_map.add_patch(matplotlib.patches.Circle((row['lon'],
                                                row['lat']),
                                            radius=0.1,
                                            facecolor='red',
                                            edgecolor='black',
                                            alpha=1))
    ax_full.text(0.18,0.99-0.98*(i+0.5)/len(left),
                 row['SEF_ID'][4:],
                 horizontalalignment='right',
                 verticalalignment='center',
                 size=10,
                 color='black')
    ax_full.add_patch(Circle((0.185,
                              0.99-0.98*(i+0.5)/len(left)),
                             radius=0.001,
                             facecolor=(1,0,0,1),
                             edgecolor=(0,0,0,1),
                             alpha=1))

    mp=pos_map_in_full(row['lat'],row['lon'])
    ax_full.add_line(matplotlib.lines.Line2D(
            xdata=(0.185,mp['x']),
            ydata=(0.99-0.98*(i+0.5)/len(left),mp['y']),
            linestyle='solid',
            linewidth=0.2,
            color=(1,0,0,1.0),
            zorder=1))
    i=i+1
# Right-hand half
right=stations[stations['lon']>lon_split]
right=right.sort_values('lat',ascending=False)
i=0.0
for index, row in right.iterrows():
    ax_map.add_patch(matplotlib.patches.Circle((row['lon'],
                                                row['lat']),
                                            radius=0.1,
                                            facecolor='red',
                                            edgecolor='black',
                                            alpha=1))
    ax_full.text(0.82,0.99-0.98*(i+0.5)/len(right),
                 row['SEF_ID'][4:],
                 horizontalalignment='left',
                 verticalalignment='center',
                 size=10,
                 color='black')
    ax_full.add_patch(Circle((0.815,
                              0.99-0.98*(i+0.5)/len(right)),
                             radius=0.001,
                             facecolor=(1,0,0,1),
                             edgecolor=(0,0,0,1),
                             alpha=1))

    mp=pos_map_in_full(row['lat'],row['lon'])
    ax_full.add_line(matplotlib.lines.Line2D(
            xdata=(0.815,mp['x']),
            ydata=(0.99-0.98*(i+0.5)/len(right),mp['y']),
            linestyle='solid',
            linewidth=0.2,
            color=(1,0,0,1.0),
            zorder=1))
    i=i+1

# Output as png
fig.savefig('../figures/stations_map.png')