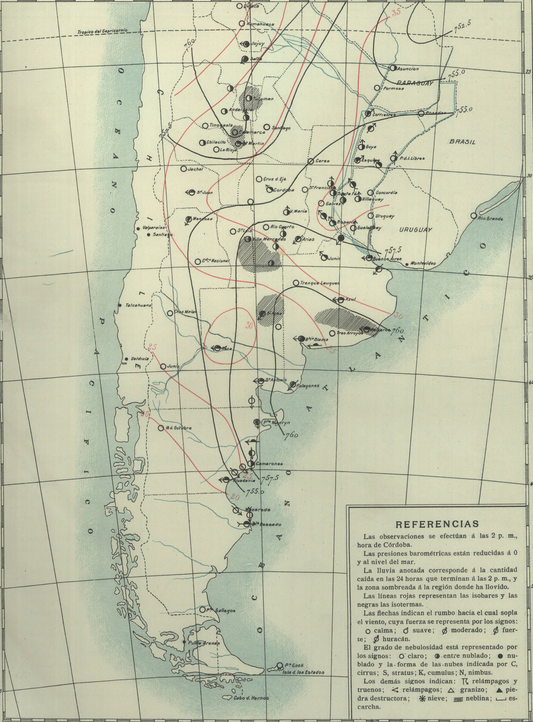
Argentine Daily Weather Reports 1902: Station location
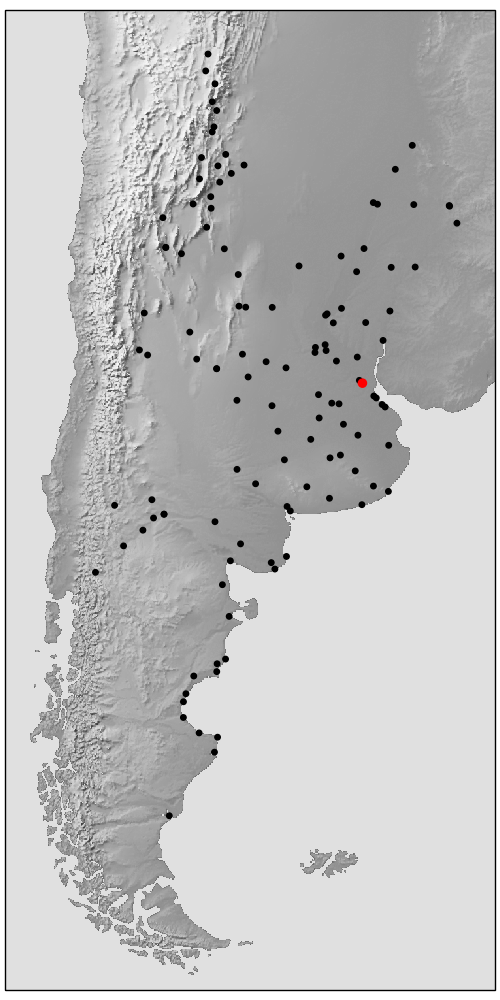
Locations of the Argentine DWR stations, with one selected one (here Zarate) highlighted in red.
Code to make the plot
#!/usr/bin/env python

# Plot Argentinian DWR station locations, highlighting the selected one

import os
import pandas
import numpy

import matplotlib
from matplotlib.backends.backend_agg import \
             FigureCanvasAgg as FigureCanvas
from matplotlib.figure import Figure
from matplotlib.patches import Circle

import cartopy
import cartopy.crs as ccrs

import argparse
parser = argparse.ArgumentParser()
parser.add_argument("--id", help="Station to compare",
                    type=str,required=True)
args = parser.parse_args()

# Find the directory with this script in
try:
    bindir=os.path.abspath(os.path.dirname(__file__))
except NameError:
    bindir='.'

fig=Figure(figsize=(5,10),  # Width, Height (inches)
           dpi=100,
           facecolor=(0.88,0.88,0.88,1),
           edgecolor=None,
           linewidth=0.0,
           frameon=False,
           subplotpars=None,
           tight_layout=None)
canvas=FigureCanvas(fig)
font = {'family' : 'sans-serif',
        'sans-serif' : 'Arial',
        'weight' : 'normal',
        'size'   : 16}
matplotlib.rc('font', **font)

# Argentina-centred projection
projection=ccrs.RotatedPole(pole_longitude=116, pole_latitude=128.5)
scale=9
extent=[scale*-1,scale,scale*-2,scale*2]

# Map in the centre
ax_map=fig.add_axes([0.01,0.01,0.98,0.98],projection=projection)
ax_map.set_axis_off()
ax_map.set_extent(extent, crs=projection)
ax_map.background_patch.set_facecolor((0.88,0.88,0.88,1))
land_img=ax_map.background_img(name='GreyT', resolution='low')


# Load the station locations
stations=pandas.read_csv("%s/../../raw_data/Positions.csv" % bindir,
                              skipinitialspace=True,quotechar="'")
# Rotate the lats and lons into projection
rp=ax_map.projection.transform_points(ccrs.PlateCarree(),
                                  stations['lon'].values,
                                  stations['lat'].values)
stations['lon']=rp[:,0]
stations['lat']=rp[:,1]

for index, row in stations.iterrows():
    ax_map.add_patch(matplotlib.patches.Circle((row['lon'],
                                                row['lat']),
                                            radius=0.1,
                                            facecolor='black',
                                            edgecolor='black',
                                            alpha=1))
    if row['SEF_ID']==args.id:
        ax_map.add_patch(matplotlib.patches.Circle((row['lon'],
                                                row['lat']),
                                            radius=0.15,
                                            facecolor='red',
                                            edgecolor='red',
                                            alpha=1))


# Output as png
fig.savefig('figures/station_maps/%s.png' % args.id)