Transcription accuracy by page location
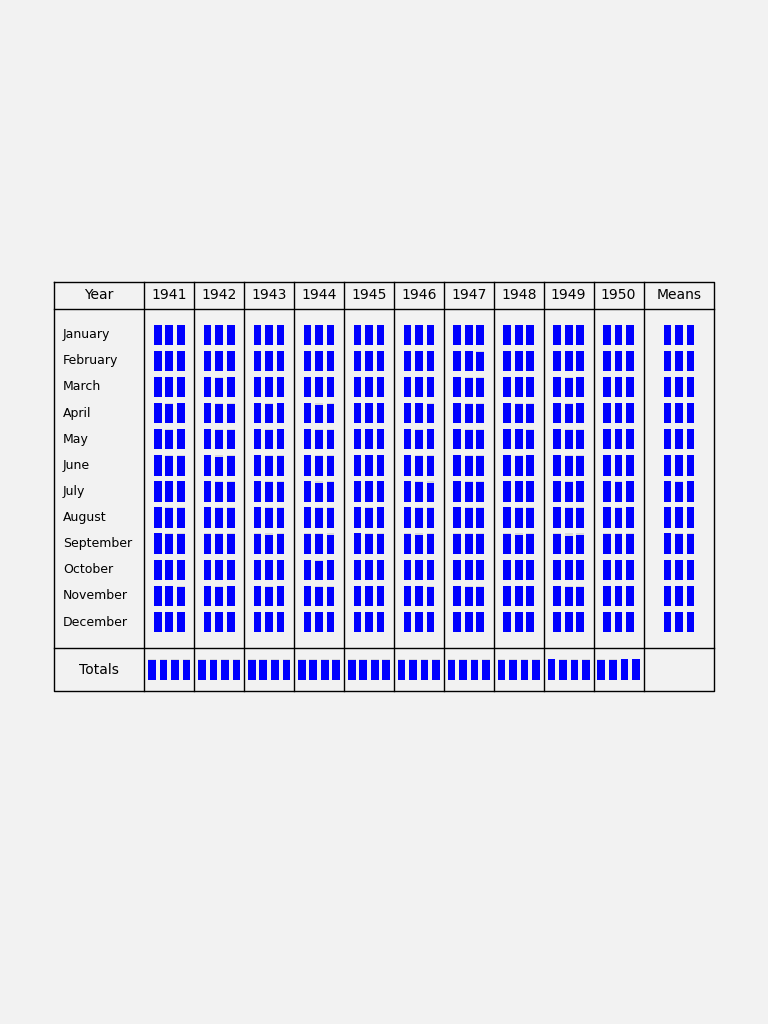
Mean probability of correctness for digits from the test dataset, as transcribed by the tuned convolutional transcriber after 50 epochs training. Partitioned by location in the image.
Code to make figure
#!/usr/bin/env python

# Success probability by position on page

import os
import sys

import tensorflow as tf
import numpy
import itertools

import matplotlib
from matplotlib.backends.backend_agg import FigureCanvasAgg as FigureCanvas
from matplotlib.figure import Figure
from matplotlib.patches import Rectangle
from matplotlib.lines import Line2D

sys.path.append("%s/../" % os.path.dirname(__file__))
from transcriberModel import transcriberModel

sys.path.append("%s/../../dataset" % os.path.dirname(__file__))
from makeDataset import getImageDataset
from makeDataset import getNumbersDataset

import argparse

parser = argparse.ArgumentParser()
parser.add_argument("--epoch", help="Epoch", type=int, required=False, default=25)
# Set nimages to a small number for fast testing
parser.add_argument(
    "--nimages",
    help="No of test cases to look at",
    type=int,
    required=False,
    default=None,
)
args = parser.parse_args()

# Set up the model and load the weights at the chosen epoch
transcriber = transcriberModel()
weights_dir = ("%s/ML_ATB2/models/tuned_convolutional_transcriber/" + "Epoch_%04d") % (
    os.getenv("SCRATCH"),
    args.epoch - 1,
)
load_status = transcriber.load_weights("%s/ckpt" % weights_dir)
# Check the load worked
load_status.assert_existing_objects_matched()

# Make the probability matrix
testImages = getImageDataset(purpose="test", nImages=args.nimages)
testNumbers = getNumbersDataset(purpose="test", nImages=args.nimages)
testData = tf.data.Dataset.zip((testImages, testNumbers))
count = 0
pmatrix = numpy.zeros((436))
for testCase in testData:
    image = testCase[0]
    orig = testCase[1]
    encoded = transcriber(tf.reshape(image, [1, 1024, 768, 3]), training=False)
    for tidx in range(436):
        originalDigit = numpy.where(orig[tidx, :] == 1.0)[0][0]
        dgProbabilities = encoded[0, tidx, originalDigit]
        pmatrix[tidx] += dgProbabilities
    count += 1
pmatrix /= count

# Plot encoded using same method as original plot
fig = Figure(
    figsize=(7.68, 10.24),
    dpi=100,
    facecolor="white",
    edgecolor="black",
    linewidth=0.0,
    frameon=False,
    subplotpars=None,
    tight_layout=None,
)
canvas = FigureCanvas(fig)
# Paint the background white - why is this needed?
ax_full = fig.add_axes([0, 0, 1, 1])
ax_full.set_xlim([0, 1])
ax_full.set_ylim([0, 1])
ax_full.add_patch(
    matplotlib.patches.Rectangle((0, 0), 1, 1, fill=True, facecolor=(.95,.95,.95,1))
)

ax_full.set_axis_off()
imp = {
    "scale": 1.0,
    "xscale": 1.0,
    "yscale": 1.0,
    "xshift": 0.0,  # pixels, +ve right
    "yshift": 0.0,  # pixels, +ve up
    "rotate": 0.0,  # degrees clockwise
    "linewidth": 1.0,
    "bgcolour": (1.0, 1.0, 1.0),
    "fgcolour": (0.0, 0.0, 0.0),
    "yearHeight": 0.066,  # Fractional height of year row
    "totalsHeight": 0.105,  # Fractional height of totals row
    "monthsWidth": 0.137,  # Fractional width of months row
    "meansWidth": 0.107,  # Fractional width of means row
    "fontSize": 10,
    "year": 1941,
}

# Box with the data in
topLeft = (0.07 + imp["xshift"] / 768, 0.725 + imp["yshift"] / 1024)
topRight = (
    0.93 + imp["xshift"] / 768 + (imp["xscale"] - 1) * 0.86,
    0.725 + imp["yshift"] / 1024,
)
bottomLeft = (0.07 + imp["xshift"] / 768, 0.325 + imp["yshift"] / 1024)
bottomRight = (
    0.93 + imp["xshift"] / 768 + (imp["xscale"] - 1) * 0.86,
    0.325 + imp["yshift"] / 1024 - (imp["yscale"] - 1) * 0.4,
)
ax_full.add_line(
    Line2D(
        xdata=(topLeft[0], topRight[0], bottomRight[0], bottomLeft[0], topLeft[0]),
        ydata=(topLeft[1], topRight[1], bottomRight[1], bottomLeft[1], topLeft[1]),
        linestyle="solid",
        linewidth=imp["linewidth"],
        color=imp["fgcolour"],
        zorder=1,
    )
)


def topAt(x):  # x is fraction along top line
    return (
        topRight[0] * x + topLeft[0] * (1 - x),
        topRight[1] * x + topLeft[1] * (1 - x),
    )


def bottomAt(x):
    return (
        bottomRight[0] * x + bottomLeft[0] * (1 - x),
        bottomRight[1] * x + bottomLeft[1] * (1 - x),
    )


def leftAt(y):  # y is fraction of way from bottom to top
    return (
        topLeft[0] * y + bottomLeft[0] * (1 - y),
        topLeft[1] * y + bottomLeft[1] * (1 - y),
    )


def rightAt(y):
    return (
        topRight[0] * y + bottomRight[0] * (1 - y),
        topRight[1] * y + bottomRight[1] * (1 - y),
    )


# Draw the grid
lft = leftAt(1.0 - imp["yearHeight"])
rgt = rightAt(1.0 - imp["yearHeight"])
ax_full.add_line(
    Line2D(
        xdata=(lft[0], rgt[0]),
        ydata=(lft[1], rgt[1]),
        linestyle="solid",
        linewidth=imp["linewidth"],
        color=imp["fgcolour"],
        zorder=1,
    )
)
lft = leftAt(imp["totalsHeight"])
rgt = rightAt(imp["totalsHeight"])
ax_full.add_line(
    Line2D(
        xdata=(lft[0], rgt[0]),
        ydata=(lft[1], rgt[1]),
        linestyle="solid",
        linewidth=imp["linewidth"],
        color=imp["fgcolour"],
        zorder=1,
    )
)
tp = topAt(imp["monthsWidth"])
bm = bottomAt(imp["monthsWidth"])
ax_full.add_line(
    Line2D(
        xdata=(tp[0], bm[0]),
        ydata=(tp[1], bm[1]),
        linestyle="solid",
        linewidth=imp["linewidth"],
        color=imp["fgcolour"],
        zorder=1,
    )
)
tp = topAt(1.0 - imp["meansWidth"])
bm = bottomAt(1.0 - imp["meansWidth"])
ax_full.add_line(
    Line2D(
        xdata=(tp[0], bm[0]),
        ydata=(tp[1], bm[1]),
        linestyle="solid",
        linewidth=imp["linewidth"],
        color=imp["fgcolour"],
        zorder=1,
    )
)
for yrl in range(1, 10):
    x = imp["monthsWidth"] + yrl * (1.0 - imp["meansWidth"] - imp["monthsWidth"]) / 10
    tp = topAt(x)
    bm = bottomAt(x)
    ax_full.add_line(
        Line2D(
            xdata=(tp[0], bm[0]),
            ydata=(tp[1], bm[1]),
            linestyle="solid",
            linewidth=imp["linewidth"],
            color=imp["fgcolour"],
            zorder=1,
        )
    )
# Add the fixed text
tp = topAt(imp["monthsWidth"] / 2)
lft = leftAt(1.0 - imp["yearHeight"] / 2)
ax_full.text(
    tp[0],
    lft[1],
    "Year",
    fontsize=imp["fontSize"],
    horizontalalignment="center",
    verticalalignment="center",
)
tp = topAt(1.0 - imp["meansWidth"] / 2)
lft = leftAt(1.0 - imp["yearHeight"] / 2)
ax_full.text(
    tp[0],
    lft[1],
    "Means",
    fontsize=imp["fontSize"],
    horizontalalignment="center",
    verticalalignment="center",
)
tp = topAt(imp["monthsWidth"] / 2)
lft = leftAt(imp["totalsHeight"] / 2)
ax_full.text(
    tp[0],
    lft[1],
    "Totals",
    fontsize=imp["fontSize"],
    horizontalalignment="center",
    verticalalignment="center",
)
months = (
    "January",
    "February",
    "March",
    "April",
    "May",
    "June",
    "July",
    "August",
    "September",
    "October",
    "November",
    "December",
)
tp = topAt(imp["monthsWidth"] / 10)
for mdx in range(len(months)):
    lft = leftAt(
        1.0
        - imp["yearHeight"]
        - (mdx + 1)
        * (1.0 - imp["yearHeight"] - imp["totalsHeight"])
        / (len(months) + 1)
    )
    ax_full.text(
        tp[0],
        lft[1],
        months[mdx],
        fontsize=imp["fontSize"] - 1,
        horizontalalignment="left",
        verticalalignment="center",
    )
lft = leftAt(1.0 - imp["yearHeight"] / 2)
for ydx in range(10):
    x = (
        imp["monthsWidth"]
        + (ydx + 0.5) * (1.0 - imp["meansWidth"] - imp["monthsWidth"]) / 10
    )
    tp = topAt(x)
    ax_full.text(
        tp[0],
        lft[1],
        "%04d" % (imp["year"] + ydx),
        fontsize=imp["fontSize"],
        horizontalalignment="center",
        verticalalignment="center",
    )

# Add the transcribed numbers
tidx = 0
for yri in range(10):
    x = (
        imp["monthsWidth"]
        + (yri + 0.5) * (1.0 - imp["meansWidth"] - imp["monthsWidth"]) / 10
    )
    tp = topAt(x)
    for mni in range(12):
        lft = leftAt(
            1.0
            - imp["yearHeight"]
            - (mni + 1)
            * (1.0 - imp["yearHeight"] - imp["totalsHeight"])
            / (len(months) + 1)
        )
        for dgi in range(3):
            ax_full.add_patch(
                matplotlib.patches.Rectangle(
                    (tp[0] - 0.015 + dgi * 0.015 - 0.005, lft[1] - 0.01),
                    0.01,
                    0.02,
                    fill=True,
                    facecolor=(0, 0, 0, 0.1),
                )
            )
            ax_full.add_patch(
                matplotlib.patches.Rectangle(
                    (tp[0] - 0.015 + dgi * 0.015 - 0.005, lft[1] - 0.01),
                    0.01,
                    0.02 * pmatrix[tidx],
                    fill=True,
                    facecolor="blue",
                )
            )
            tidx += 1
# Add the monthly means
tp = topAt(1.0 - imp["meansWidth"] / 2)
for mni in range(12):
    lft = leftAt(
        1.0
        - imp["yearHeight"]
        - (mni + 1)
        * (1.0 - imp["yearHeight"] - imp["totalsHeight"])
        / (len(months) + 1)
    )
    for dgi in range(3):
        ax_full.add_patch(
            matplotlib.patches.Rectangle(
                (tp[0] - 0.015 + dgi * 0.015 - 0.005, lft[1] - 0.01),
                0.01,
                0.02,
                fill=True,
                facecolor=(0, 0, 0, 0.1),
            )
        )
        ax_full.add_patch(
            matplotlib.patches.Rectangle(
                (tp[0] - 0.015 + dgi * 0.015 - 0.005, lft[1] - 0.01),
                0.01,
                0.02 * pmatrix[tidx],
                fill=True,
                facecolor="blue",
            )
        )
        tidx += 1
# Add the annual totals
lft = leftAt(imp["totalsHeight"] / 2)
for yri in range(10):
    x = (
        imp["monthsWidth"]
        + (yri + 0.5) * (1.0 - imp["meansWidth"] - imp["monthsWidth"]) / 10
    )
    tp = topAt(x)
    inr = 0.0
    for dgi in range(4):
        ax_full.add_patch(
            matplotlib.patches.Rectangle(
                (tp[0] - 0.0225 + dgi * 0.015 - 0.005, lft[1] - 0.01),
                0.01,
                0.02,
                fill=True,
                facecolor=(0, 0, 0, 0.1),
            )
        )
        ax_full.add_patch(
            matplotlib.patches.Rectangle(
                (tp[0] - 0.0225 + dgi * 0.015 - 0.005, lft[1] - 0.01),
                0.01,
                0.02 * pmatrix[tidx],
                fill=True,
                facecolor="blue",
            )
        )
        tidx += 1


# Render the figure as a png
fig.savefig("place.png")