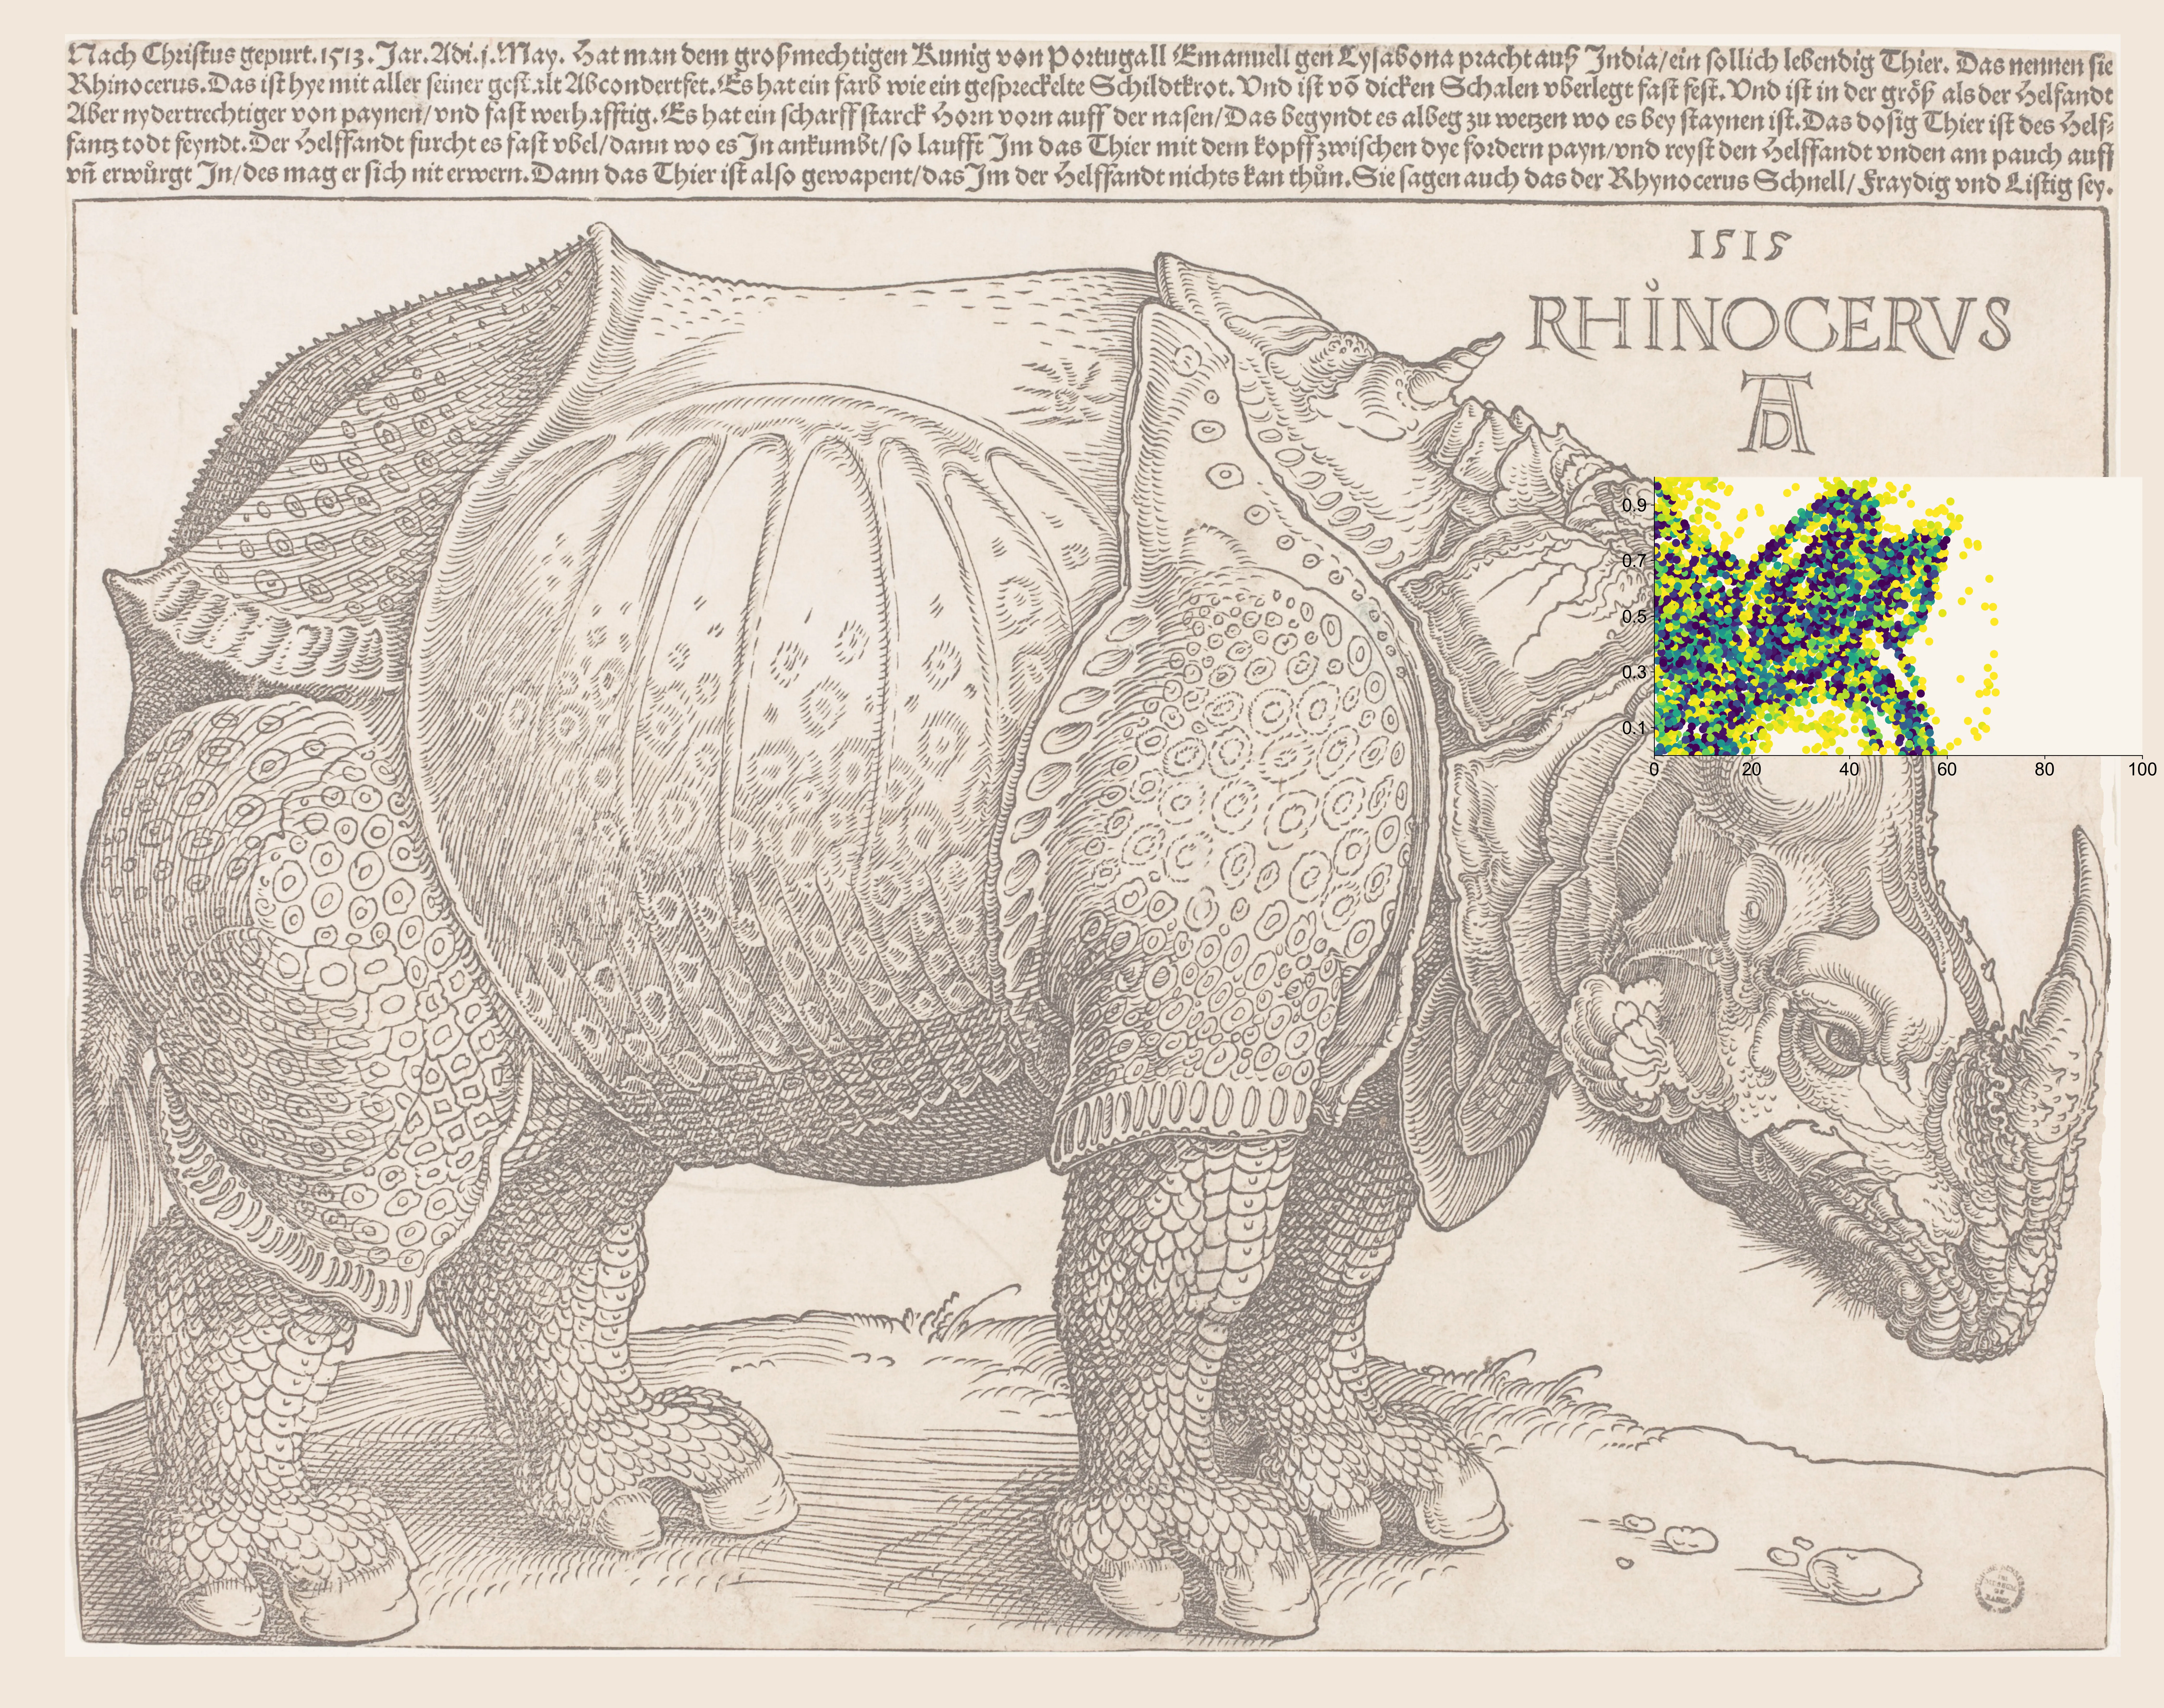
Rhinoceros: 2nd Right panel

The 2nd right panel uses a scatter plot.
# function to plot the contents of the row 2  Right panel

import sys
from utils import smoothLine, colours, viridis
import numpy as np
from scipy.stats.qmc import PoissonDisk


def p2R(fig, gspec, bg_im, bgi_extent):
    ax_2R = fig.add_subplot(
        gspec,
        frameon=True,
        xlim=[0, 100],
        xticks=[0, 20, 40, 60, 80, 100],
        ylim=[0, 1],
        yticks=[0.1, 0.3, 0.5, 0.7, 0.9],
    )
    ax_2R.set_facecolor(colours["ax_bg"])
    ax_2R.spines["right"].set_visible(False)
    ax_2R.spines["top"].set_visible(False)

    # Get the background image array section that fills this axes
    bbox = ax_2R.get_position()
    im_sh = bg_im.shape
    x0 = int((bbox.x0 - bgi_extent[0]) / (bgi_extent[1] - bgi_extent[0]) * im_sh[1])
    x1 = int((bbox.x1 - bgi_extent[0]) / (bgi_extent[1] - bgi_extent[0]) * im_sh[1])
    y0 = int((bbox.y0 - bgi_extent[2]) / (bgi_extent[3] - bgi_extent[2]) * im_sh[0])
    y1 = int((bbox.y1 - bgi_extent[2]) / (bgi_extent[3] - bgi_extent[2]) * im_sh[0])
    bg_im_f = np.flip(bg_im, axis=0)  # flip the image array to match the axes direction
    im_in_ax = bg_im_f[max(y0, 0) : min(y1, im_sh[0]), max(x0, 0) : min(x1, im_sh[1])]
    # Pad if axes extend beyond the image array
    if x0 < 0:
        im_in_ax = np.insert(
            im_in_ax,
            0,
            np.full([im_in_ax.shape[0], -x0, im_in_ax.shape[2]], 1.0),
            axis=1,
        )
    if x1 > im_sh[1]:
        im_in_ax = np.append(
            im_in_ax,
            np.full([im_in_ax.shape[0], x1 - im_sh[1], im_in_ax.shape[2]], 1.0),
            axis=1,
        )
    if y0 < 0:
        im_in_ax = np.insert(
            im_in_ax,
            0,
            np.full([-y0, im_in_ax.shape[1], im_in_ax.shape[2]], 1.0),
            axis=0,
        )
    if y1 > im_sh[0]:
        im_in_ax = np.append(
            im_in_ax,
            np.full([y1 - im_sh[0], im_in_ax.shape[1], im_in_ax.shape[2]], 1.0),
            axis=0,
        )
    # Image to greyscale
    im_in_ax = np.mean(im_in_ax, axis=2)

    # Make a fine mesh of points covering the grid
    engine = PoissonDisk(d=2, radius=0.01)
    points = engine.fill_space()
    x = points[:, 0]
    y = points[:, 1]
    # Get rid of points from right hand side of image (blank)
    y = y[x < 0.7]
    x = x[x < 0.7]
    # For each point, get the value from the image
    xidx = (x * im_in_ax.shape[1]).astype(int)
    yidx = (y * im_in_ax.shape[0]).astype(int)
    z = im_in_ax[yidx, xidx]
    # Trim out the points that are white
    x = x[z < 0.85]
    y = y[z < 0.85]
    z = z[z < 0.85]
    # Scatterplot coloured by image intensity
    ax_2R.scatter(x * 100, y, c=z, cmap=viridis, s=50)

    return ax_2R
