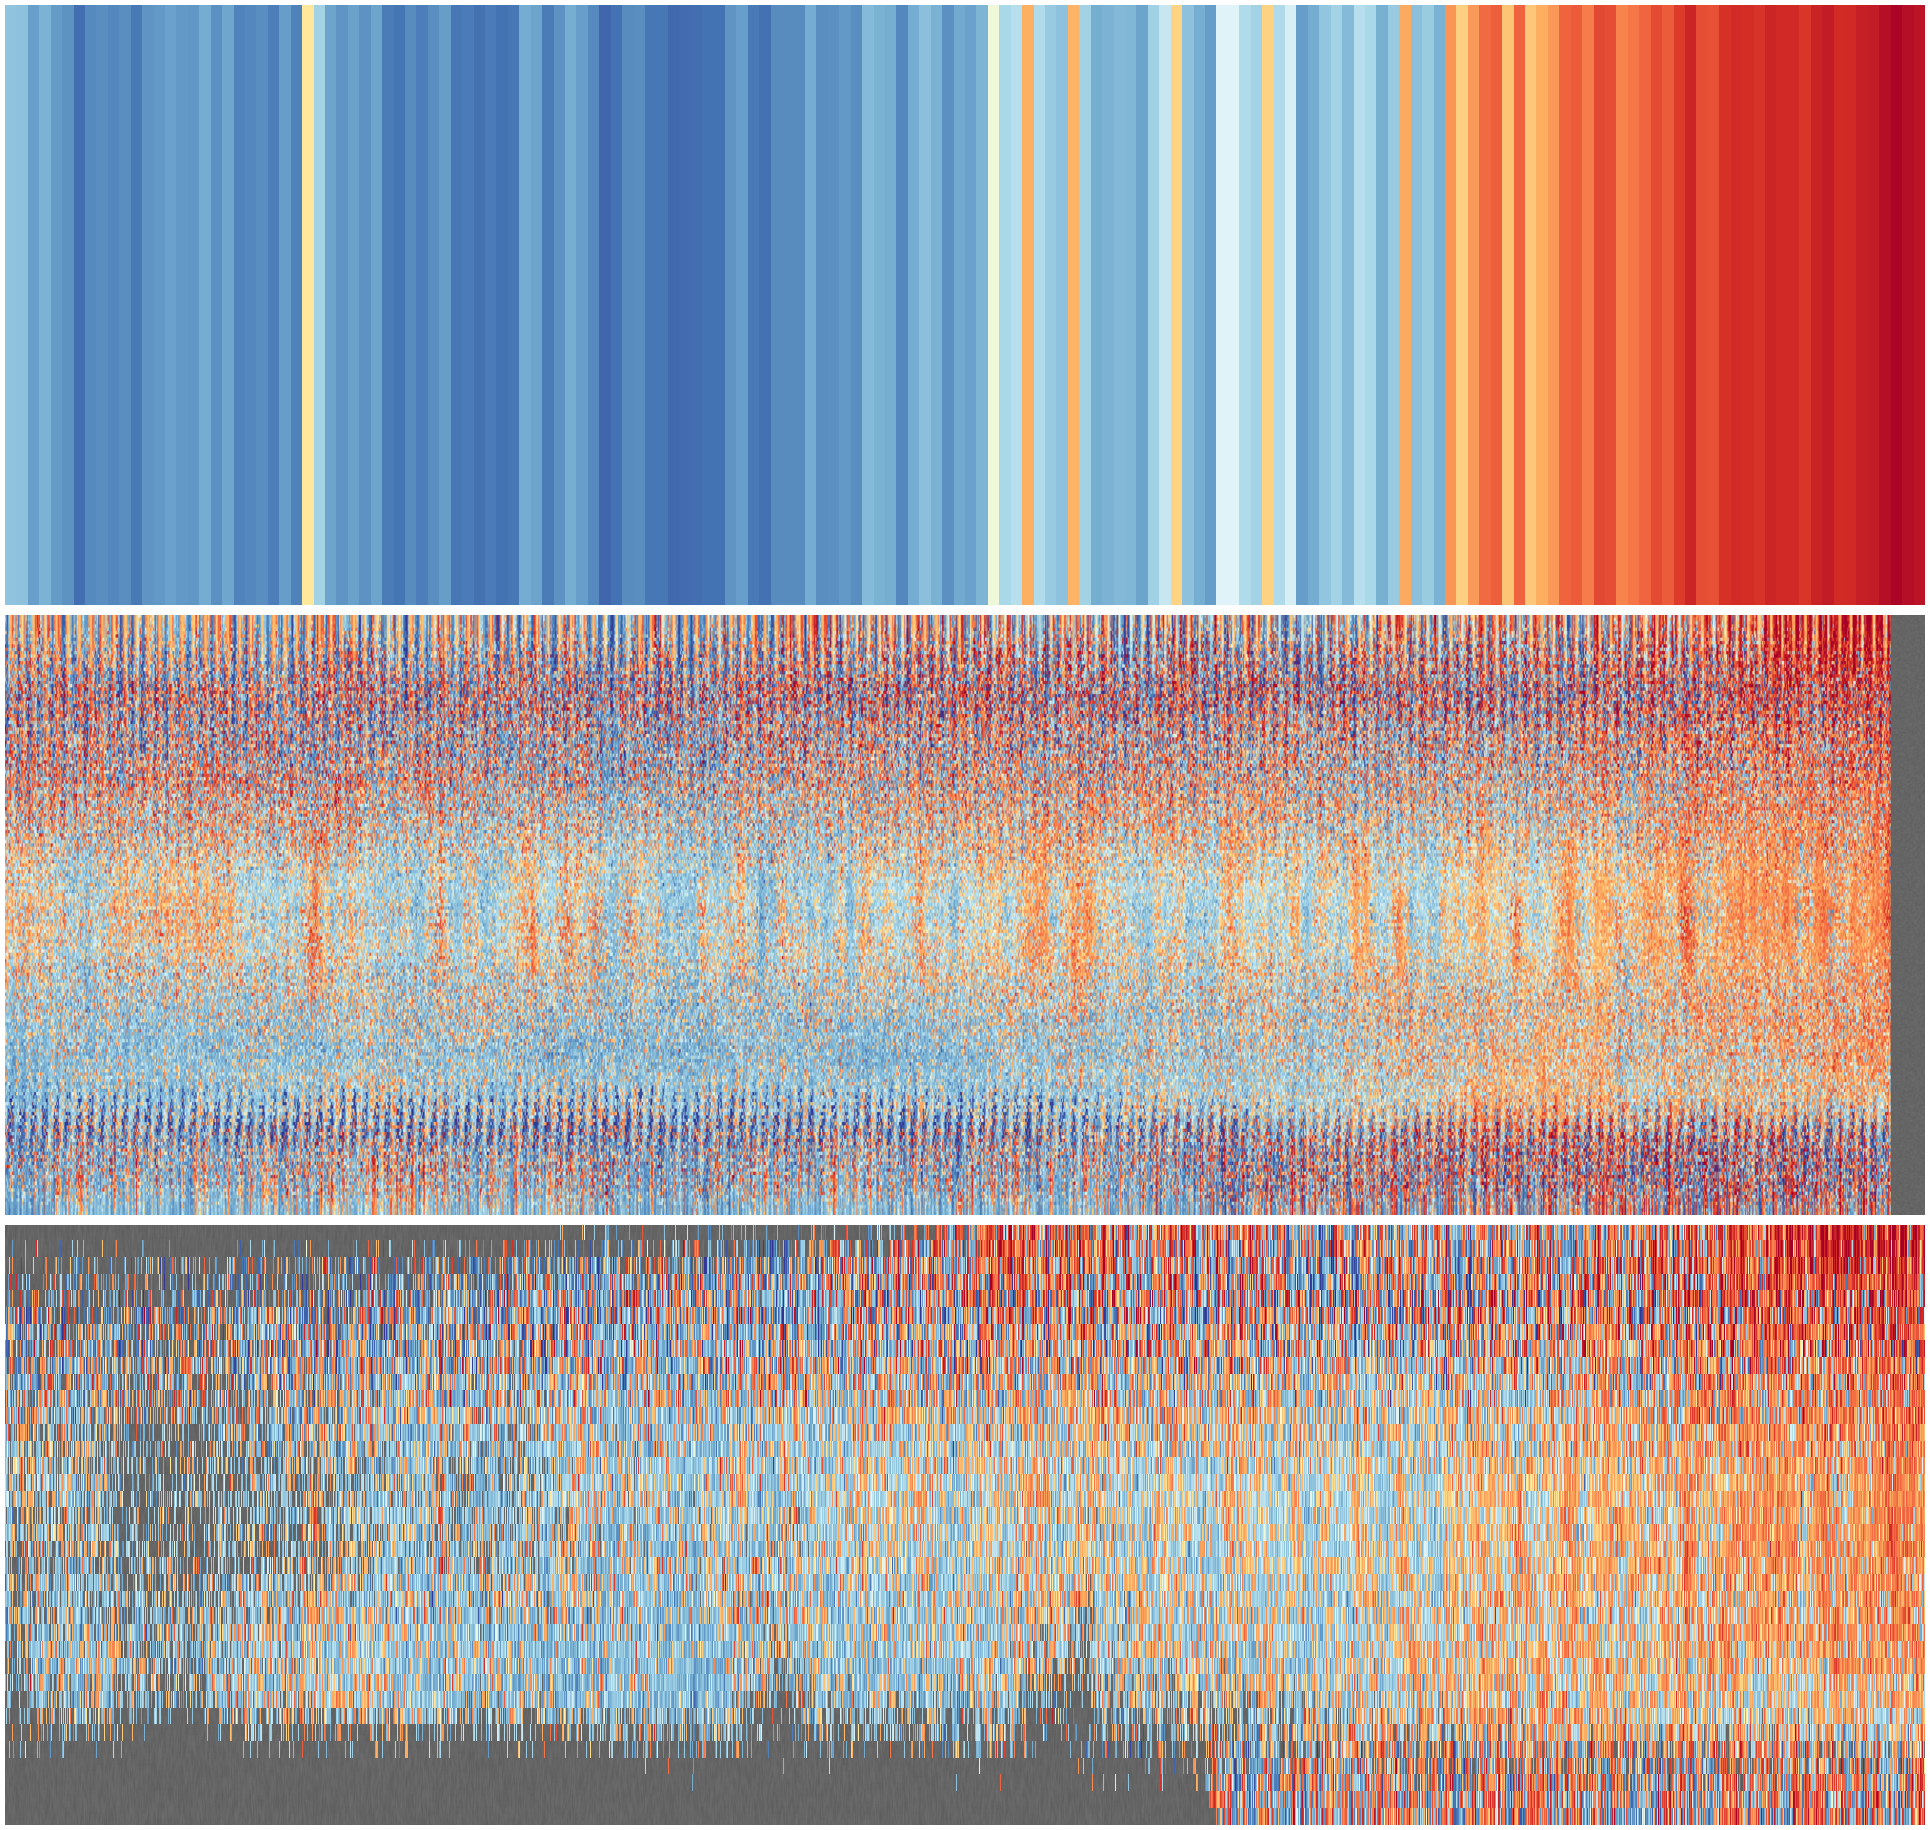
# Shared plotting functions

from matplotlib.lines import Line2D
import numpy as np
import matplotlib.colors as colors
import datetime
from mpl_toolkits.axes_grid1.inset_locator import inset_axes


# Add a line of latitude to an axes
def add_latline(ax, latitude):
    latl = (latitude + 90) / 180
    ax.add_line(
        Line2D(
            ax.get_xlim(),
            [latl, latl],
            linewidth=0.75,
            color=(0.2, 0.2, 0.2, 1),
            zorder=200,
        )
    )


# Add a vertical date line
def add_dateline(ax_main, ax_ticks, year, fontsize=14):
    x = datetime.datetime(year, 1, 1, 0, 0).timestamp()
    ax_main.add_line(
        Line2D([x, x], [0.0, 1.0], linewidth=0.75, color=(0.2, 0.2, 0.2, 1), zorder=200)
    )
    if ax_ticks is not None:
        # Add the year label
        tfp = (x - ax_ticks.get_xlim()[0]) / (
            ax_ticks.get_xlim()[1] - ax_ticks.get_xlim()[0]
        )
        if tfp < 0.02 or tfp > 0.98:
            return
        ax_ticks.text(
            x,
            0.0,
            "%04d" % year,
            horizontalalignment="center",
            verticalalignment="bottom",
            color="black",
            clip_on=True,
            fontsize=fontsize,
            zorder=200,
        )


# Add a colorbar
def add_colorbar(
    ax_cb, img, label="Anomaly(C)", ticks=[-2, -1, -0.5, 0, 0.5, 1, 2], fontsize=12
):
    ax_cb.set_axis_off()
    cbm = ax_cb.get_figure().colorbar(
        img,
        ax=ax_cb,
        location="right",
        orientation="vertical",
        fraction=1.0,
        label=label,
        ticks=ticks,
    )
    cbm.ax.yaxis.label.set_size(fontsize)  # Set label font size
    cbm.ax.tick_params(labelsize=fontsize)  # Set tick label font size


# Add a textured grey background to an axes
def texture_background(ax, s=(2000, 600)):
    nd2 = np.random.rand(s[1], s[0])
    clrs = []
    for shade in np.linspace(0.42 + 0.01, 0.36 + 0.01):
        clrs.append((shade, shade, shade, 1))
    yg = np.linspace(ax.get_ylim()[0], ax.get_ylim()[1], s[1])
    xg = np.linspace(ax.get_xlim()[0], ax.get_xlim()[1], s[0])
    img = ax.pcolormesh(
        xg,
        yg,
        nd2,
        cmap=colors.ListedColormap(clrs),
        alpha=1.0,
        shading="gouraud",
        zorder=10,
    )
    return img


# Plot a set of three datasets
def plot_dataset(
    ax,
    dts,
    ndata,
    cmap,
    norm,
    colorbar=True,
    ticks=False,
    ticks_fontsize=14,
    cm_fontsize=14,
):
    ax.set_axis_off()

    # Sub axes - main, colorbar, maybe xticks
    if ticks:
        ax_main = ax.inset_axes(
            bounds=[0.0, 0.05, 0.95, 0.95],
        )
        ax_cb = ax.inset_axes(bounds=[0.955, 0.05 + 0.15 * 0.95, 0.05, 0.7 * 0.95])
        ax_ticks = ax.inset_axes(
            bounds=[0.0, 0.0, 0.95, 0.05],
        )
    else:
        ax_main = ax.inset_axes(bounds=[0.0, 0.0, 0.95, 1.0])
        ax_cb = ax.inset_axes(bounds=[0.955, 0.15, 0.045, 0.7])
        ax_ticks = None

    ax_main.set_axis_off()
    ax_main.set_xlim(
        (dts[0] + datetime.timedelta(days=1)).timestamp(),
        (dts[-1] - datetime.timedelta(days=1)).timestamp(),
    )
    ax_main.set_ylim((1, 0))
    ax_cb.set_axis_off()
    if ax_ticks is not None:
        ax_ticks.set_axis_off()
        ax_ticks.set_xlim(
            (dts[0] + datetime.timedelta(days=1)).timestamp(),
            (dts[-1] - datetime.timedelta(days=1)).timestamp(),
        )
        ax_ticks.set_ylim((0, 1))

    # Add a textured grey background
    imgt = texture_background(ax_main)

    # Main plot
    s = ndata.shape
    y = 1.0 - np.linspace(0, 1, s[0] + 1)
    x = [(a - datetime.timedelta(days=15)).timestamp() for a in dts]
    x.append((dts[-1] + datetime.timedelta(days=15)).timestamp())
    imgm = ax_main.pcolorfast(x, y, ndata, cmap=cmap, alpha=1.0, norm=norm, zorder=100)

    # Add a latitude grid
    for lat in (-60, -30, 0, 30, 60):
        add_latline(ax_main, lat)

    # Add a date grid

    for year in range((dts[0].year // 10) * 10, dts[-1].year, 10):
        add_dateline(ax_main, ax_ticks, year, ticks_fontsize)

    # add a ColourBar
    if colorbar:
        add_colorbar(ax_cb, imgm, label="Anomaly (C)", fontsize=cm_fontsize)
