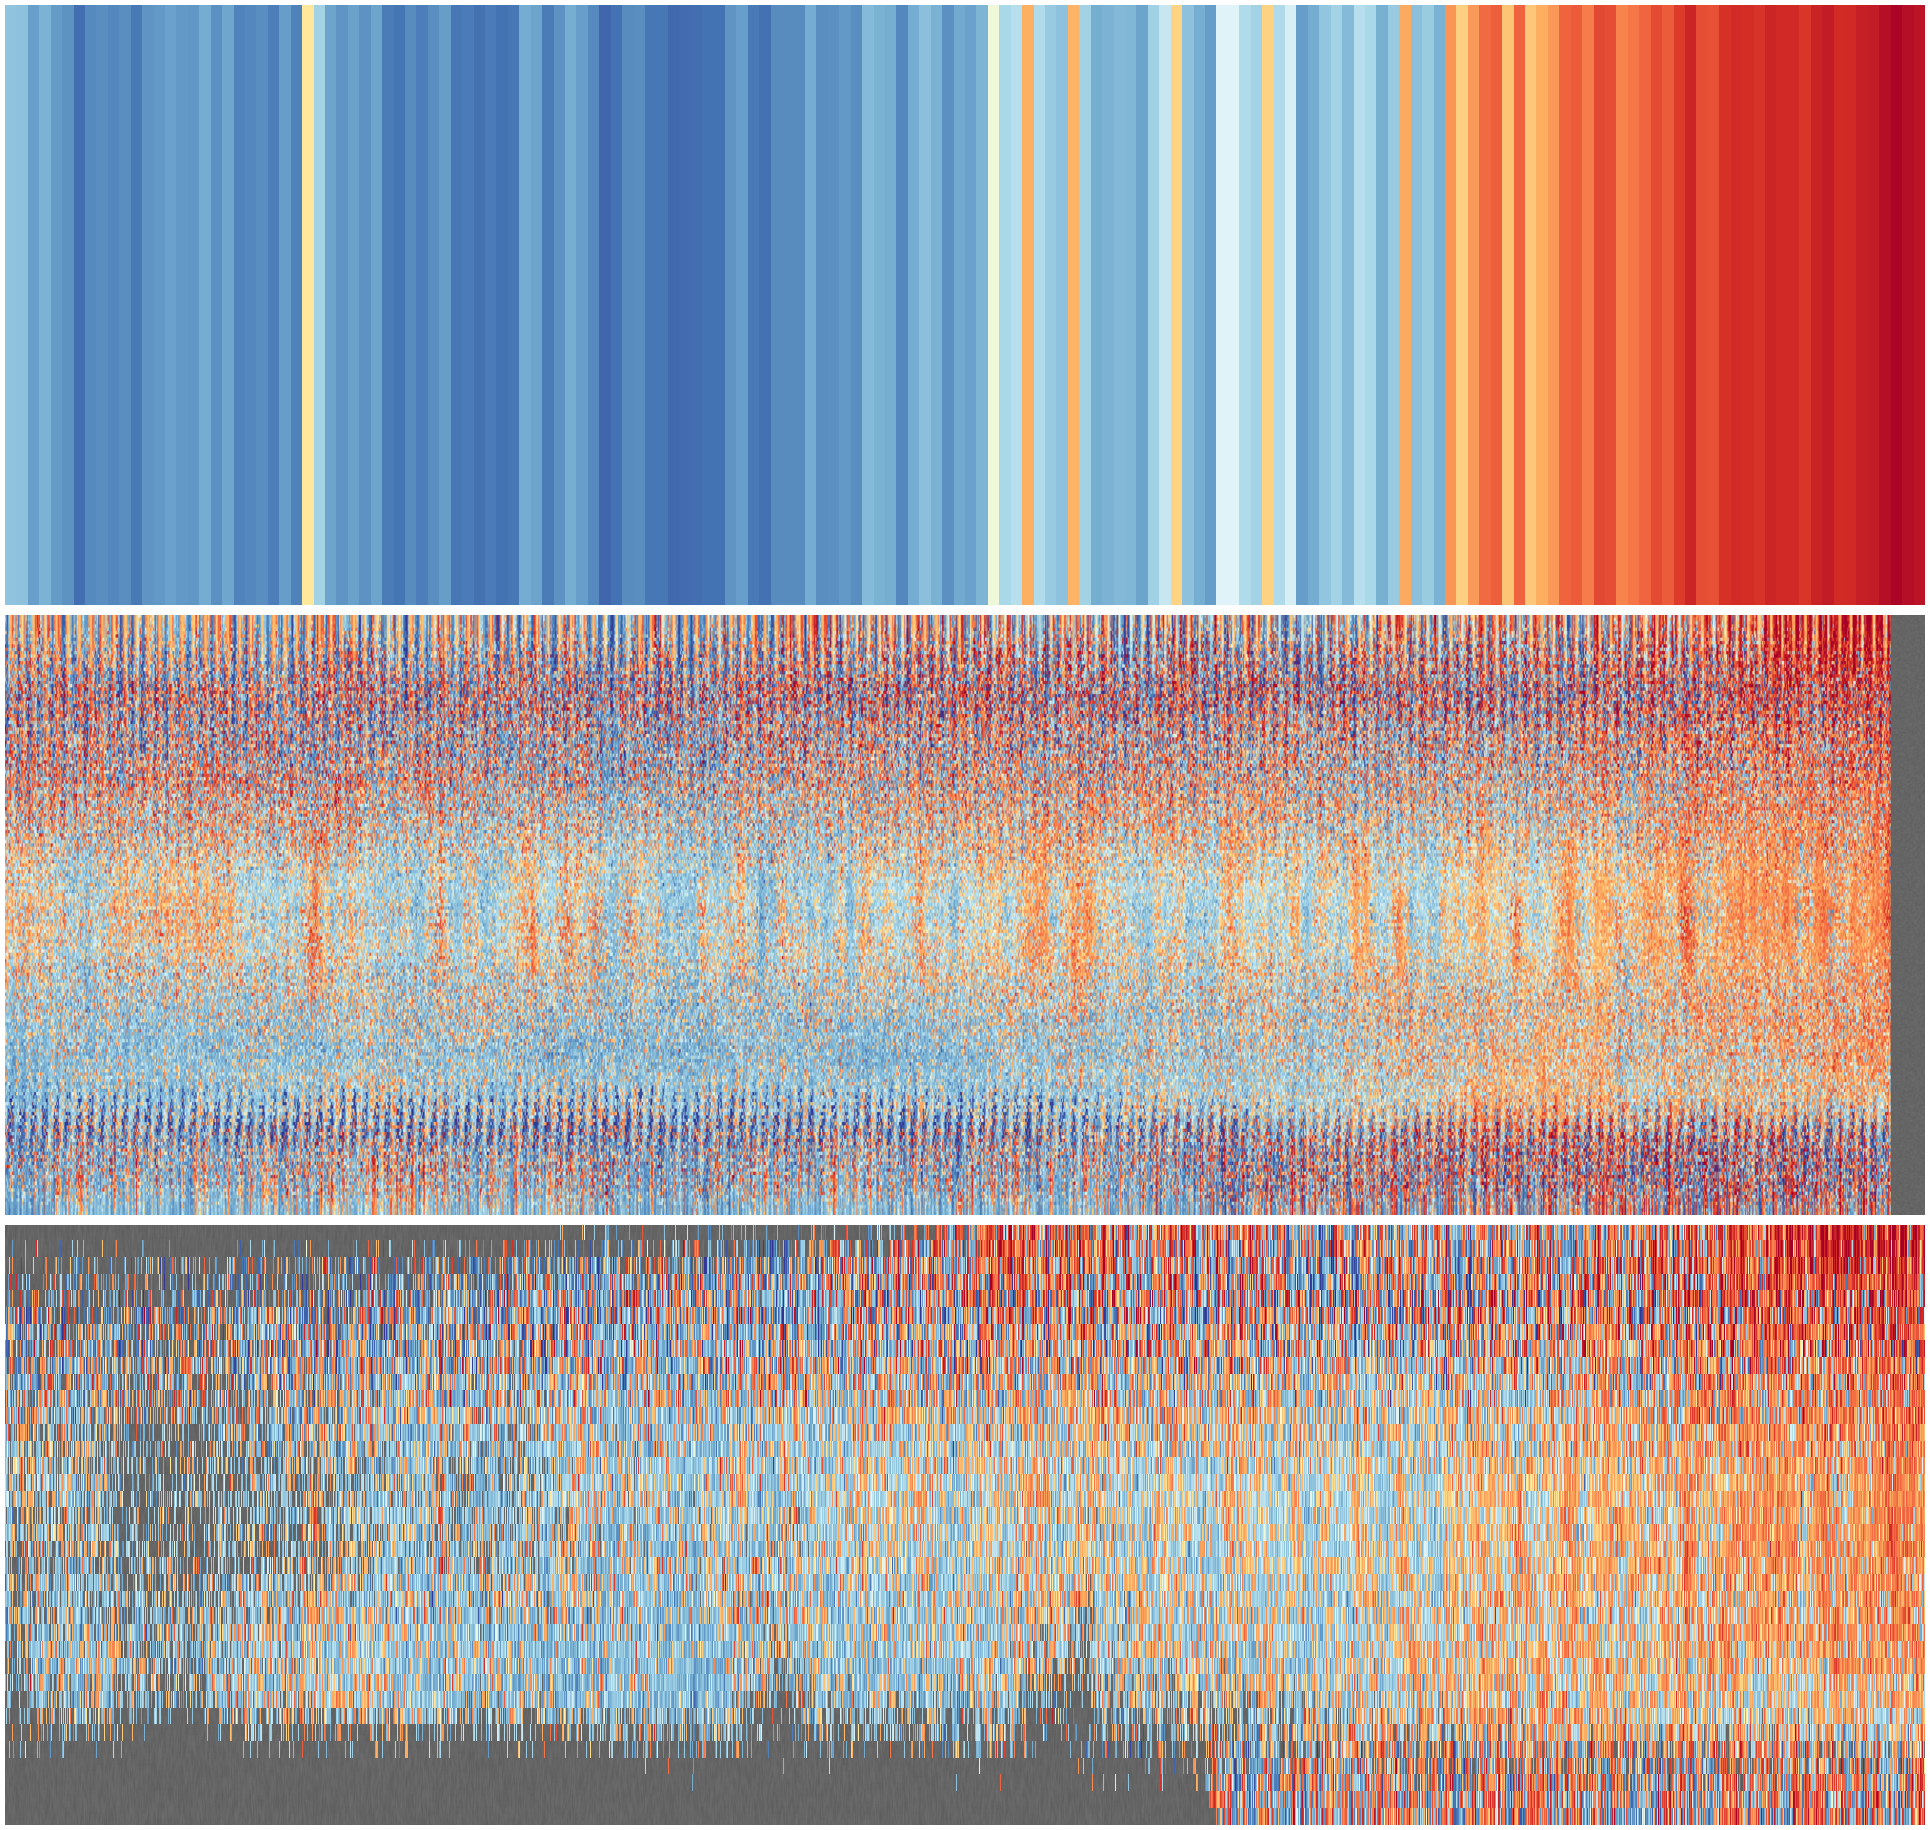
EUSTACE: Ensemble reduced to monthly averages
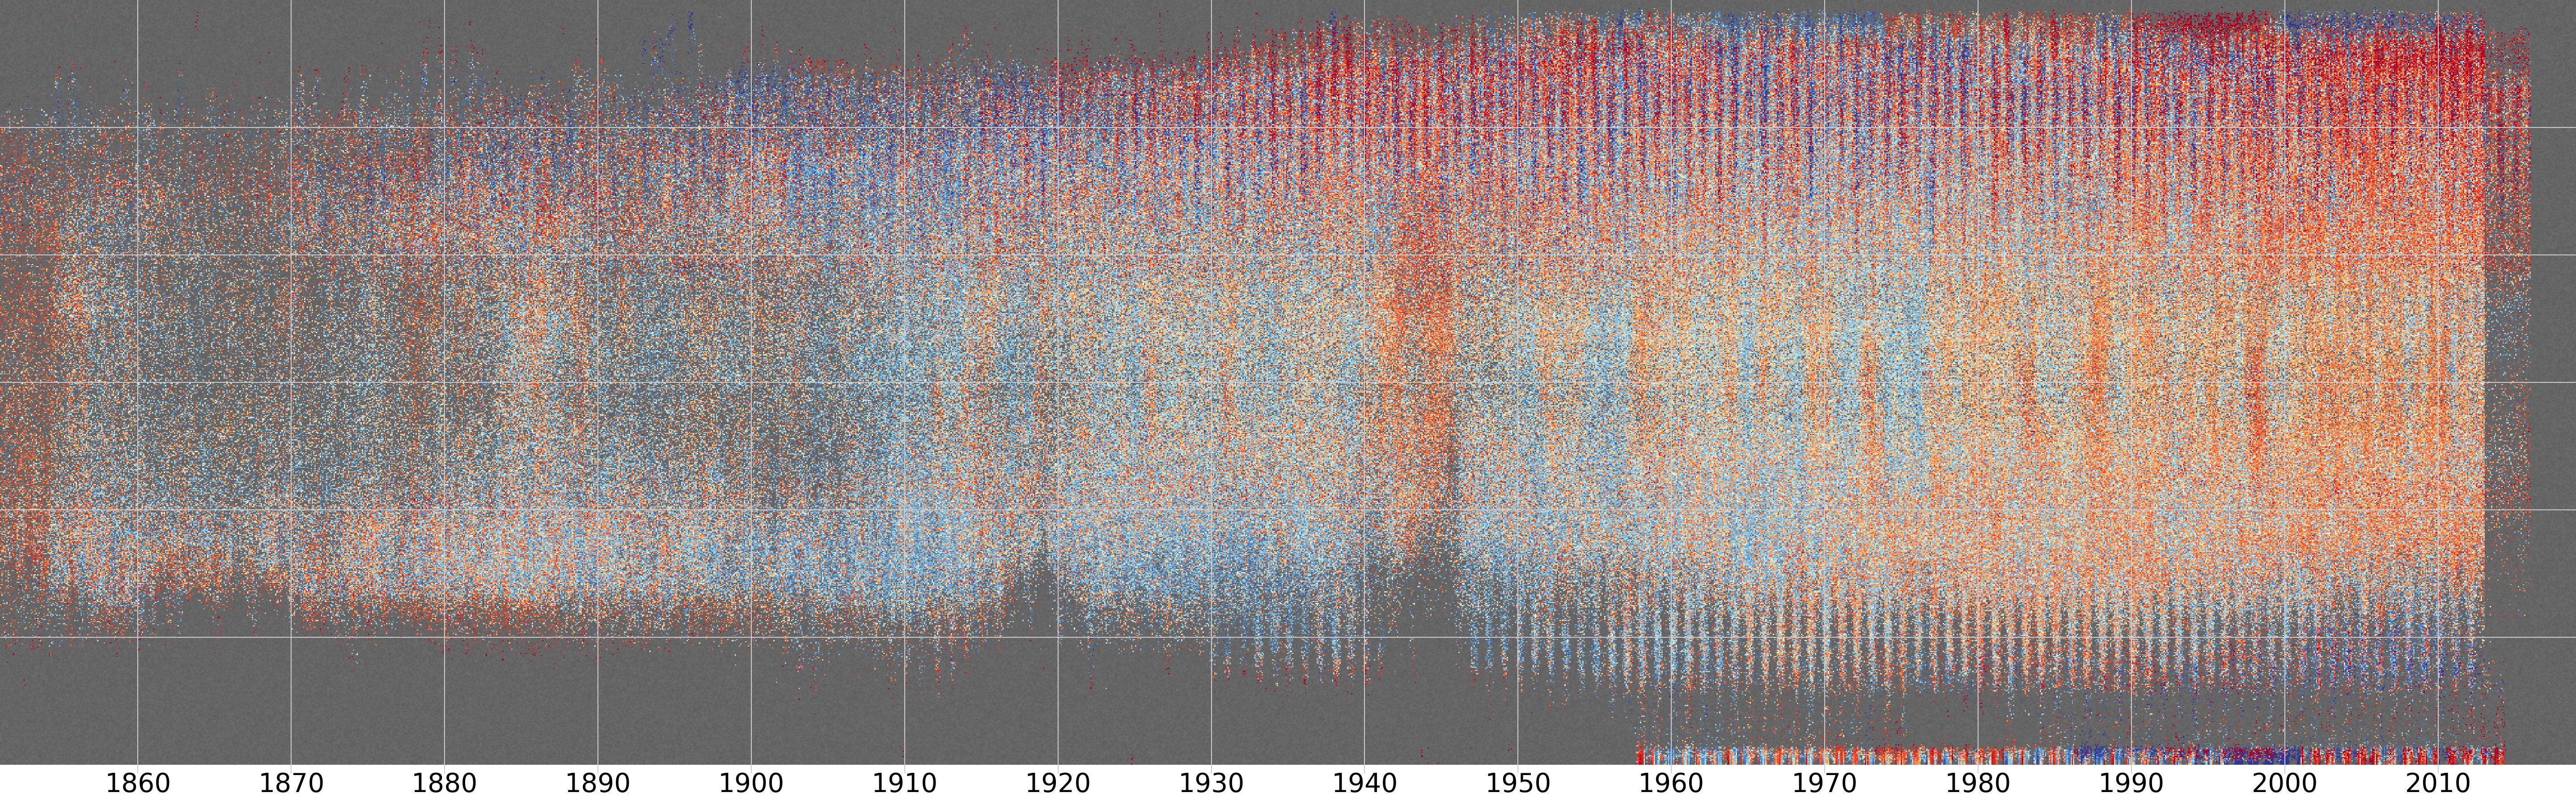
Temperature anomalies (w.r.t. 1961-90) from the EUSTACE dataset after regridding to monthly resolution. The vertical axis is latitude (south pole at the bottom, north pole at the top), and each pixel is from a randomly selected longitude and ensemble member. Grey areas show regions where EUSTACE has no data.
Here I’ve used EUSTACE 1.0 - daily-mean temperature actuals on a 0.5 degree global grid back to 1850. For purposes of comparison with HadCRUT it needs to be reduced to monthly means and to anomalies with respect to the 1961-90 average. The complication in this process is in handling missing data. I chose (arbitrarily) that a monthly average would be the mean of all the available daily averages in that month if at least 20 daily values were available (and missing otherwise). Similarly, a monthly normal is the mean of all available monthly averages in the period 1961-90 if at least 20 monthly averages are available (and missing otherwise).
Note that EUSTACE is a large dataset (the 1.0 gridded fields take up 1.7 Tb on disk and may take some time to download).