The Daily Weather Reports
“It has been desired that a great many observations should be compared throughout the British Islands (with their neighbouring coasts and seas), at certain remarkable periods, to obtain the means of deliniating or mapping the atmosphere at successive times; and thence to deduce the order of those changes of wind and weather which affect navigation and fisheries especially, besides agriculture, health, and all out-door occupations.
Such maps or charts should show the various horizontal or other currents of wind (existing within such an area) at one time, to which all other corresponding times should be reduced by allowing for the difference of longitude.
They should show the pressure and temperature of those currents - and other facts, such as the presence of clouds, rain, lightning &c., at their respective localities.
A sequence of such maps, compiled for special periods when changes have been most marked, would enable meteorologists to trace atmospheric waves as well as currents, both in plan and section, and would throw much light on meteorology.”
—Robert Fitzroy - The weather book, a Manual of Practical Meteorology (1863)
To meet this need, Fitzroy created the Daily Weather Reports (DWR). Starting on 3rd September 1860, and running up to the present day, these contain synoptic observations from weather stations in and around the British Isles, sent to the Met Office by telegraph. The stations included, and frequency of observations, vary through the period of the reports, but typically they contain data from about 50 stations, reported twice or four times daily.
Digital images of the entire DWR series are available online courtesy of the National Meteorological Library and Archive.
|
|
From about 1957, the observations reported in the DWR are included in Met Office and international databases. Some of the earlier observations have also been transcribed by a series of research projects:
- The EMULATE team transcribed pressure observations from some stations for the years 1856-1881,
- A study of severe storms across the British Isles, transcribed a subset of the pressure observations over the period 1919-1960
- The citizen science project weatherrescue.org has made a more comprehensive transcription for the years 1900-1910.
The pressure observations from these three projects have been released online. The other variables digitised for 1900-1910 are in the process of publication. This set of observations were designed to support the construction of daily weather analyses, and so are particularly well suited to support reanalysis work. This is why they have already been the subject of substantial digitisation work, and they have been used in demonstrations of the beneficial impact of data rescue on reanalysis quality.
Despite all this work, the DWRs are far from completely transcribed - only one decade (1900-1910) has been completed. More work is planned by the weatherrescue.org team, but it is unlikely that this will deliver more than one additional decade of data.

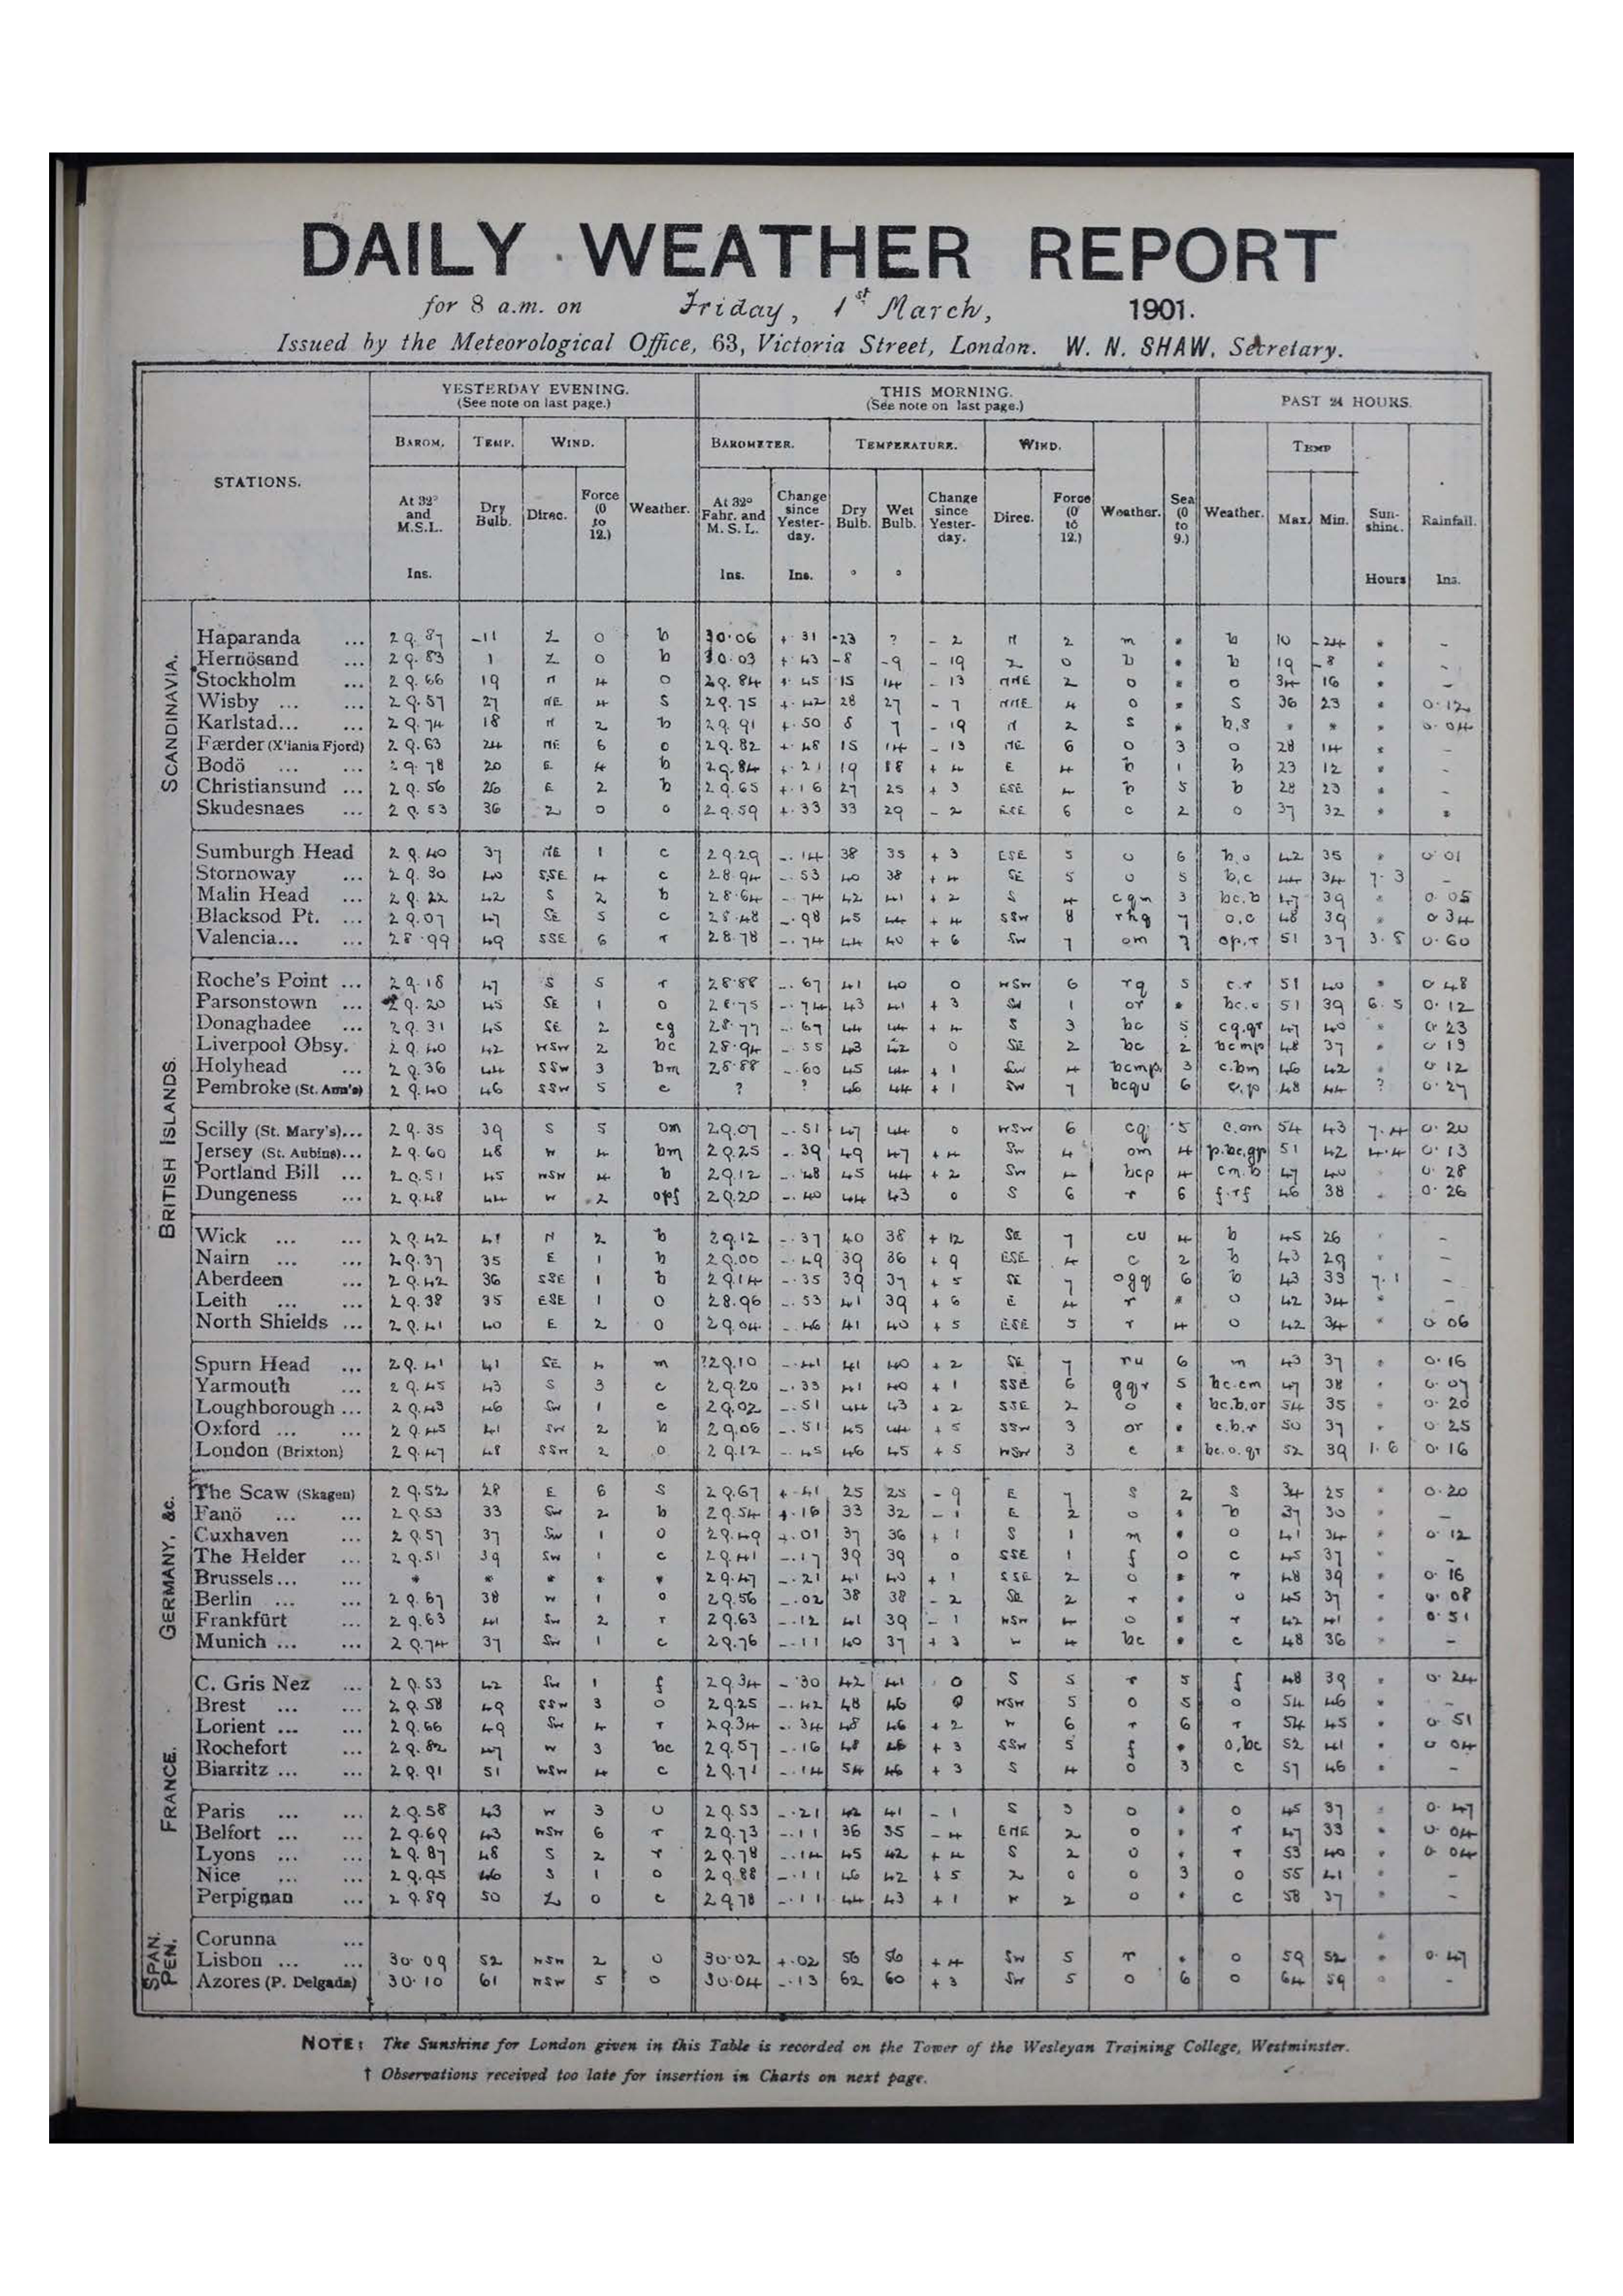
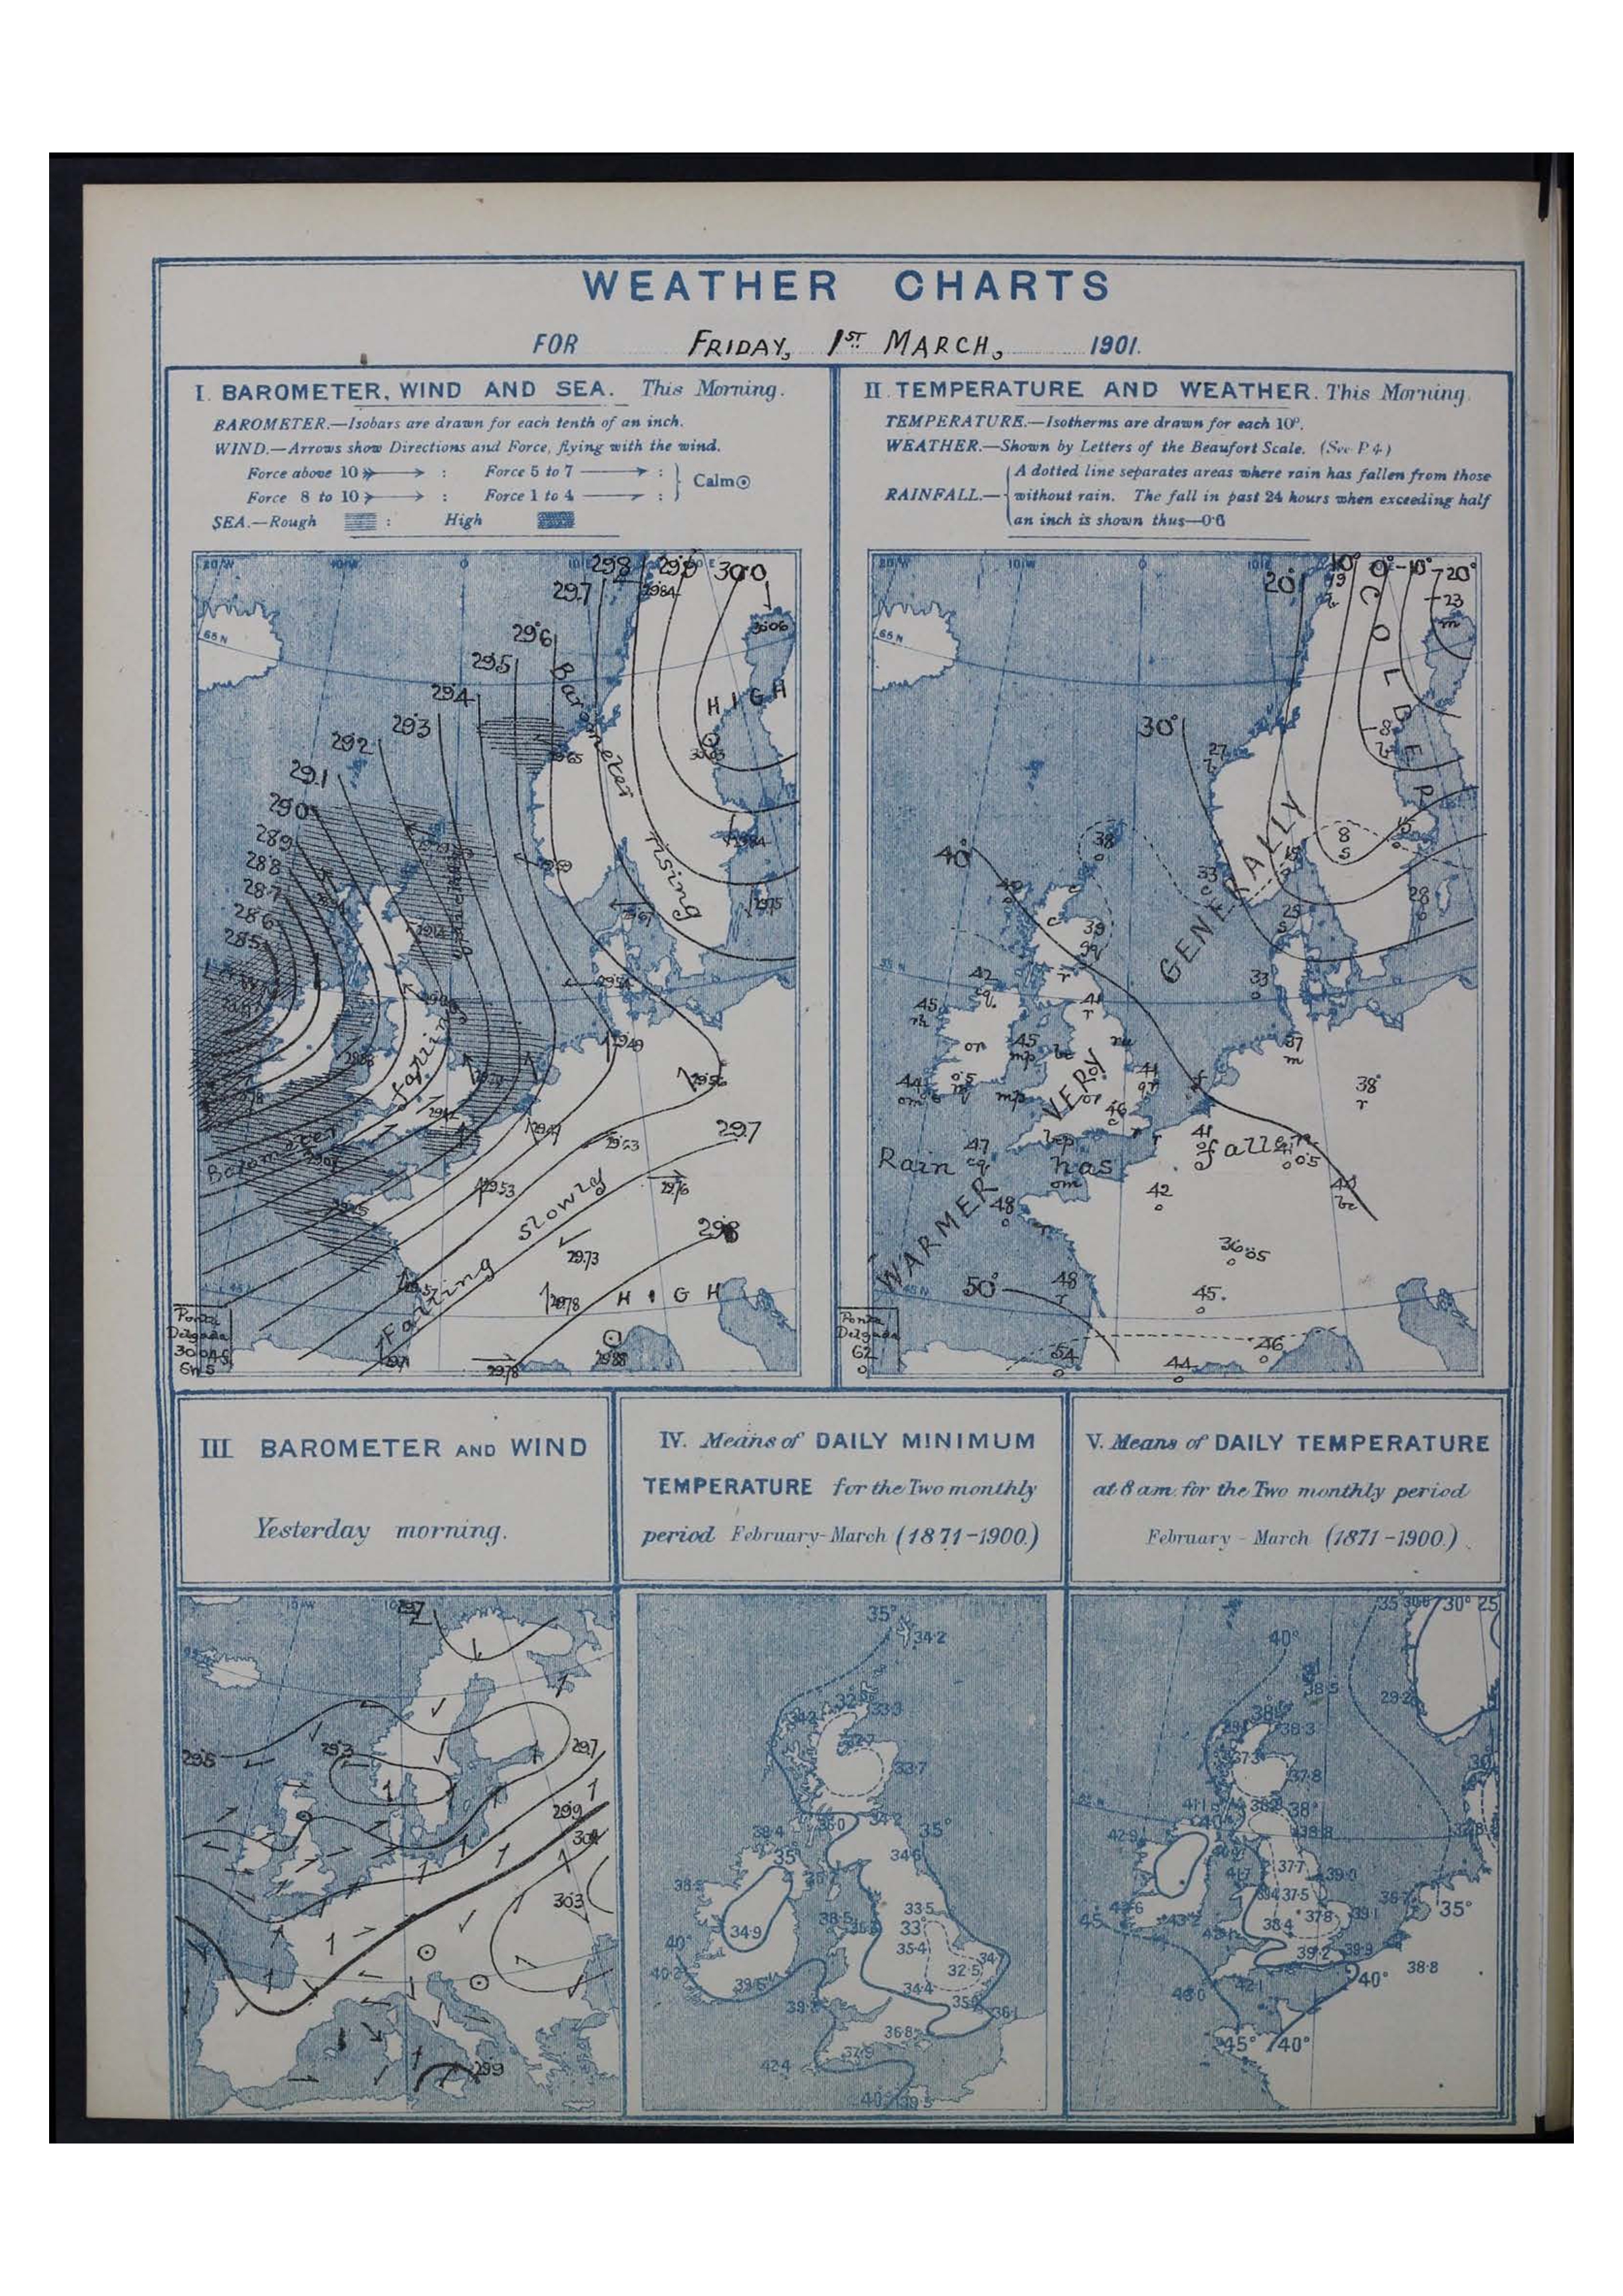
Sample DWR page from the 1860s - the period currently targeted by weatherrescue.org.