Improving 20CR with observations from the Daily Weather Reports
The newly-rescued Daily Weather Report observations are well suited to demonstrating the effect of assimilating new stations: they provide dozens of new stations, in a time and place where the existing coverage is poor, and we have 10 years of data, so there are plenty of good case studies.
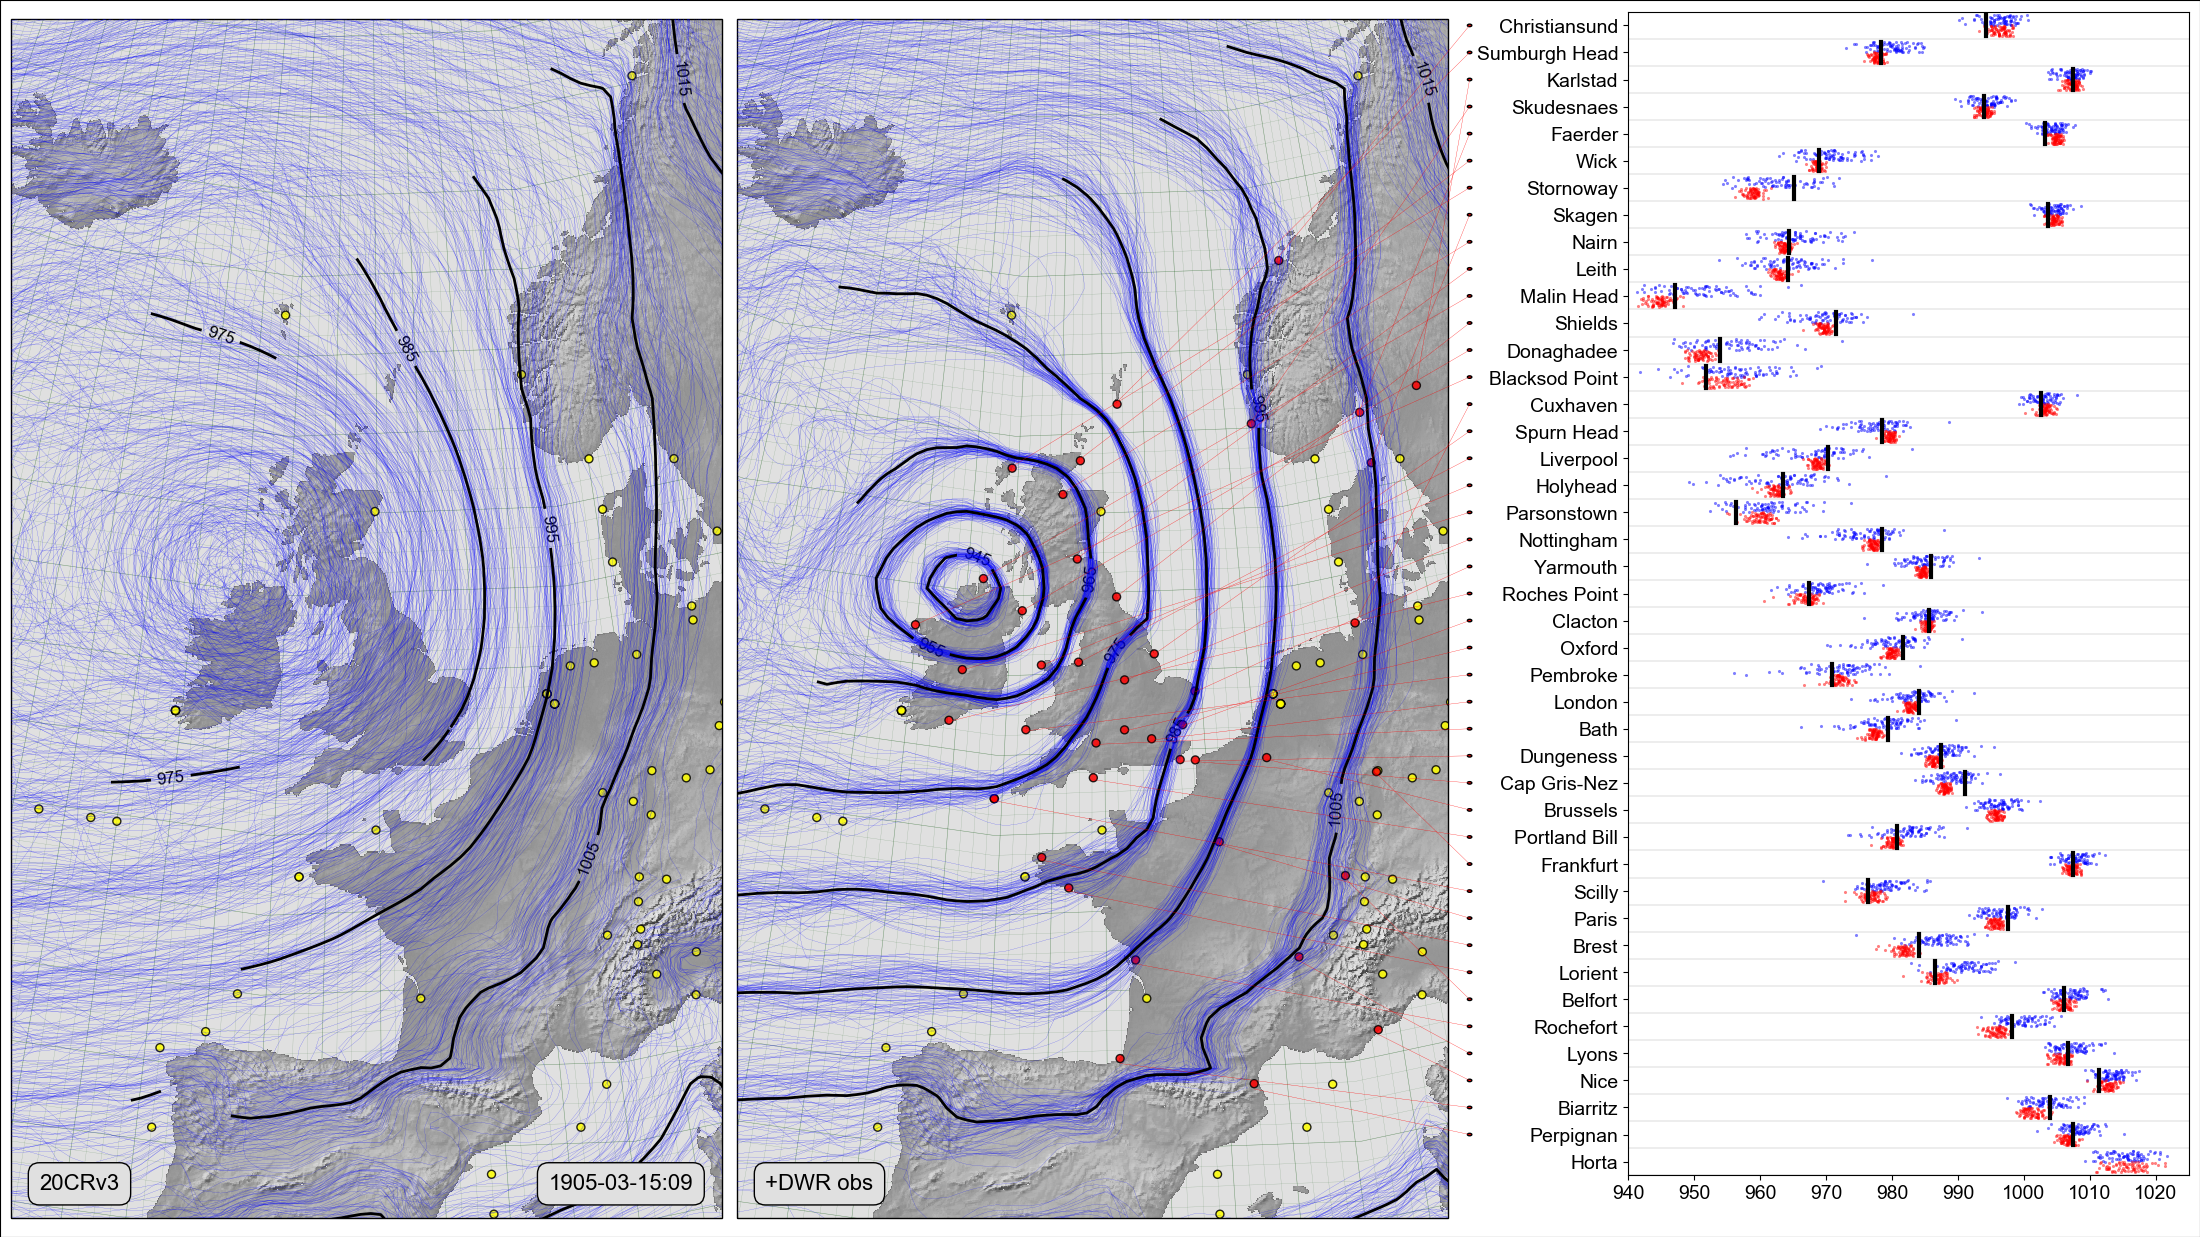
On the left, a Spaghetti-contour plot of 20CRv3 MSLP at 9 a.m. on March 15th 1905. Centre and right, Scatter-contour plot comparing the same field, after assimilating all 43 DWR observations within 8 hours of that date. The centre panel shows the 20CRv3 ensemble after assimilating all 43 station observations (red dots). The right panel compares the two ensembles with the new observations: Black lines show the observed pressures, blue dots the original 20CRv3 ensemble at the station locations, and red dots the 20CR ensemble after assimilating all the observations except the observation at that location. (Figure source).
Essentially, the difference between the left and centre figures shows the improvment in the MSLP field provided by assimilating all the new observations, and the right panel is a leave-one-out cross validation, showing that the post-assimilation field is not only more precise and less uncertain, it is also more accurate.
We can do the same thing for a range of times around the storm and see the changes in the field (Figure source):