Quality control
We know that the transcription is an imperfect process - a small fraction of the obs transcribed will be wrong. It would be ideal to identify those obs, but doing so completely and precisely is extraordinarily difficult - QC is famously a difficult and endless process. All we can do here are some basic checks - to find and flag some of the biggest errors and make sure they don’t contaminate our checks. This stage attaches a quality verdict to every observation using two independent checks, but it is not a comprehensive QC - users of the transcribed observations will need (as always) to do their own QC.
We are going to do two QC checks:
QC1 finds months where the daily transcribed values for that month sum exactly to the independent Rainfall Rescue monthly value. This generally means that all the daily values for that month have been transcribed correctly, so when this happens all days in that month will be flagged as passing QC1. Passing QC1 is a good indicator of obs quality - failing QC1 is not informative, as a problem with one day’s observation will cause all the days in that month to fail, so many good observations will fail QC1.
QC2 is a buddy check, we compare each observation with an expectation for its value constructed from nearby observations for the same day.
QC is done by three notebooks:
qc_RR_monthly_total.ipynb — QC check 1
qc_RR_regional_stats.ipynb — QC check 2, stage 1
qc_RR_secondary_ml.ipynb — QC check 2, stage 2
QC check 1 — monthly-total consistency
The first check uses the station’s own monthly totals as ground truth. For every transcription with an exact rank-1 RR match, it:
recomputes each monthly total from the consensus daily values (the median across members per day),
compares that to the matched RR monthly value, and
flags every day in that file-month as
passif the difference is within tolerance, elsefail.
This is a genuinely independent check: the RR monthly totals were digitised by a completely different process (volunteers reading the monthly sheets), so agreement is strong evidence the daily transcription is correct.
The full dataset has ~514,000 file IDs, so the notebook demonstrates the check on
a slice and submits the rest to the cluster (qc_array + qc_merge):
scripts/slurm/submit_qc.sh
Outputs land in Parquet under qc_root: qc_sessions, daily_qc_results, and
daily_qc_status.
QC check 2 — regional consistency
QC1 can only judge stations with an exact monthly match, and it fails a whole month if the total is off. QC check 2 provides a spatial second opinion, focused on the observations QC1 failed. It runs in two stages.
Stage 1 — regional neighbour statistics
For every located station-day, qc_RR_regional_stats computes robust statistics from the neighbours on the same calendar day — the median of their rainfall, the number of such neighbours, and the median absolute deviation — at both 20 km and 50 km. The station itself is always excluded. By using robust statistics (medians) we hope to limit the problems caused by the fact that neighbouring observations are not necessarily accurate.
This stage has two prerequisites, run in order:
# 1. Build the daily-consensus table first (the per-day ensemble median).
scripts/slurm/submit_daily_consensus.sh

# 2. Compute the regional statistics (reads that table).
scripts/slurm/submit_regional_stats.sh
The consensus median is precomputed once, sharded by file_id, because computing
it inside the regional shards would exhaust memory — a geographically scattered
shard needs consensus values for a near-national set of stations, and DuckDB’s
grouped median() cannot spill to disc. submit_regional_stats.sh refuses to run
until the consensus table exists.
Stage 2 — the secondary ML check
qc_RR_secondary_ml turns those regional statistics into a test. Two gradient-boosted (XGBoost) models are trained on the station consensus and regional statistics:
Model 1 predicts a station’s own consensus rainfall from its regional statistics.
Model 2 predicts the absolute error of Model 1, giving a per-row expected uncertainty.
A multiplier k is calibrated on a held-out split so that a target fraction
(default 99%) of reliable rows fall inside prediction ± k · predicted_error.
That interval is the expectation range. Each QC1-fail row is then re-judged:
inside the range →
pass(rescued),outside it →
fail(a QC suspect),no usable neighbours →
indeterminate.
Run the two dependent jobs (train, then score) with:
scripts/slurm/submit_secondary_qc.sh
Models land under secondary_qc_root/models/, and the scored flags in
secondary_qc_root/secondary_qc_status/.
QC2 uses the daily data to build a model describing the relationship between a station daily value and it’s neighbours, and then tests every value against that model - stations that deviate from expectation are flagged. This is not a great approach for precipitation observations - which have a difficult-to-model distribution - but it is both simple and automatable.
Inspecting the verdicts
Each QC notebook ends with an interactive Plotly map that colours stations by
their flag for a chosen date — pass/fail for QC1, and
pass/fail/indeterminate for the secondary check. Clicking a station copies
its specifier to the clipboard so you can pull up its full diagnostic.
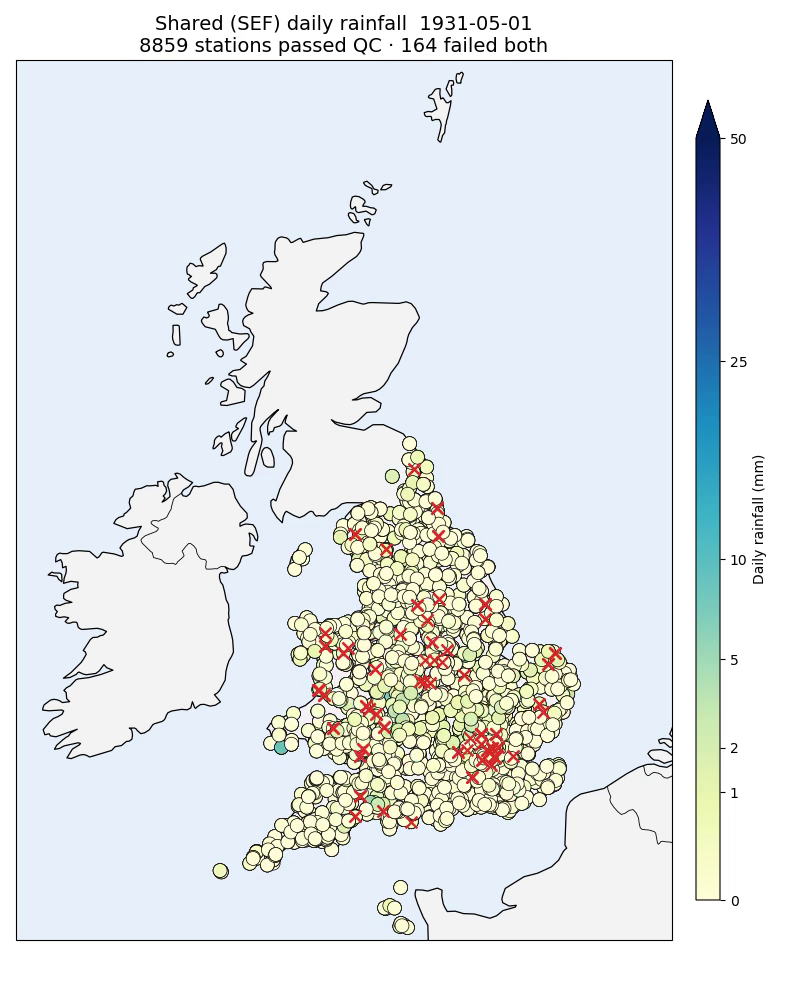
The QC verdicts made visible for a single date: stations that passed are drawn with their rainfall value, while those that failed both checks are marked with a red cross and excluded from the field.
Next: Export.