Example image with transcriptions
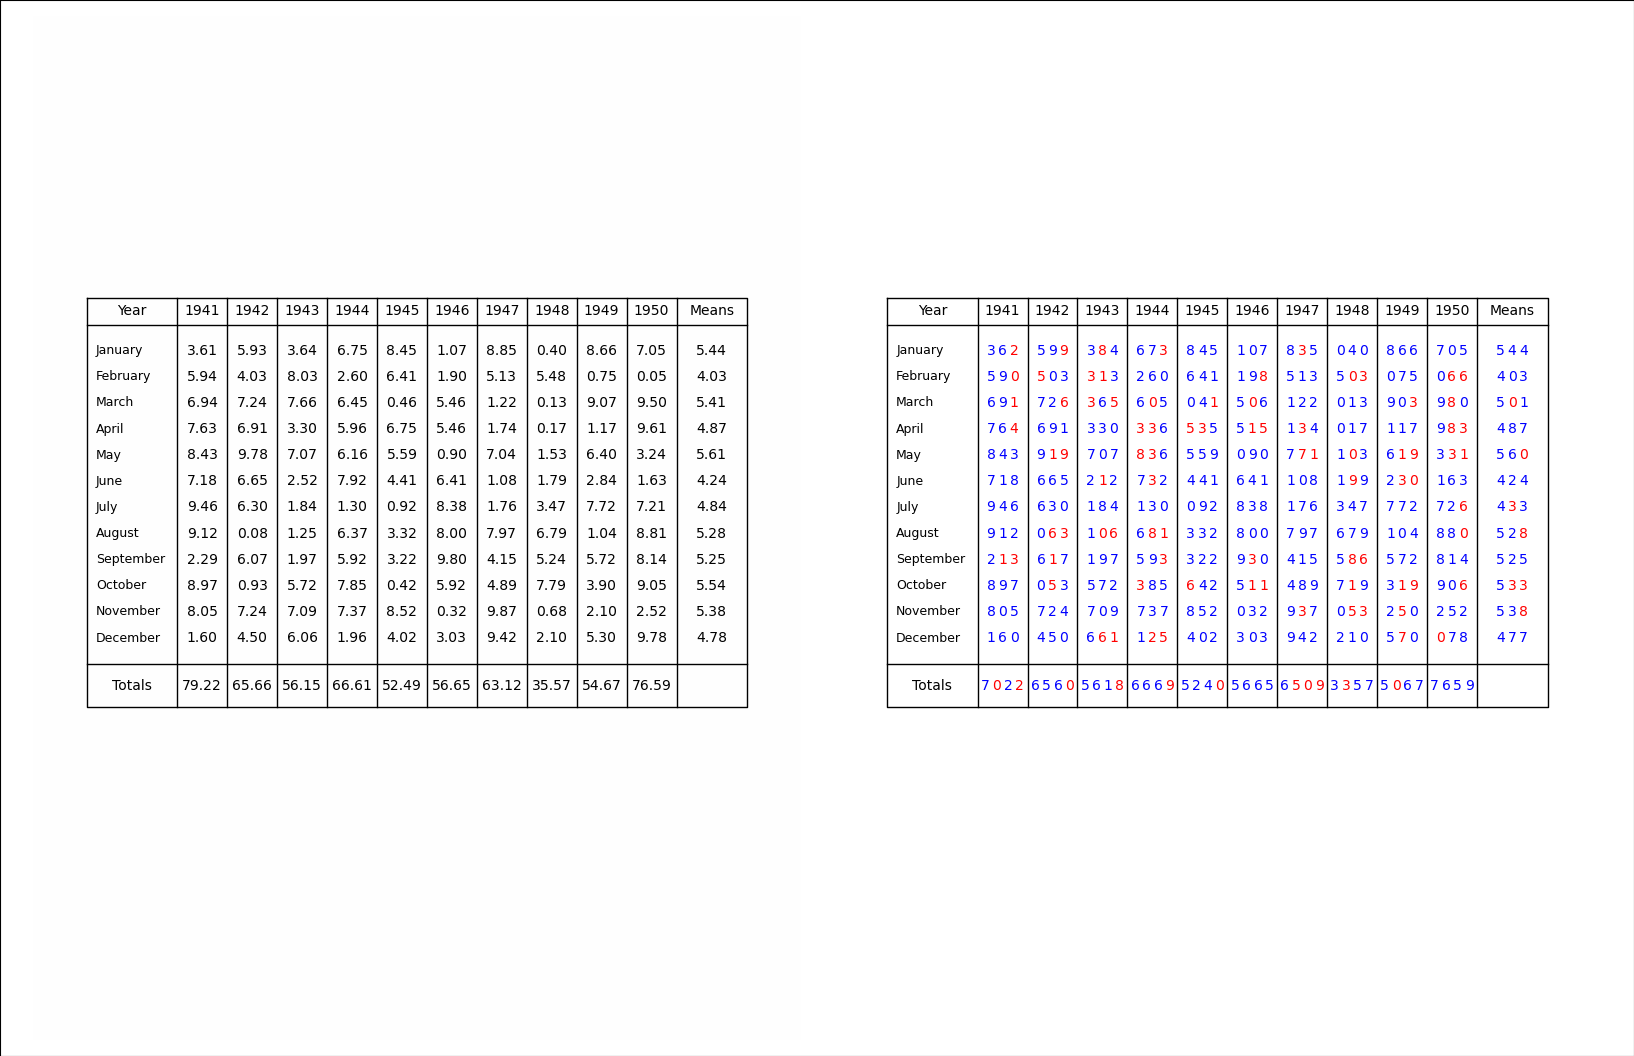
On the left, a test image from the benchmark (not part of the training dataset). On the right, the most-likely digit in each location from the deep-convolutional transcriber after 200 epochs training. Digits in blue are correct, in red mistakes.
Code to make figure
#!/usr/bin/env python

# Compare one of the test images - original v. transcribed

import os
import sys

import tensorflow as tf
import numpy
import itertools

import matplotlib
from matplotlib.backends.backend_agg import FigureCanvasAgg as FigureCanvas
from matplotlib.figure import Figure
from matplotlib.patches import Rectangle
from matplotlib.lines import Line2D

sys.path.append("%s/../" % os.path.dirname(__file__))
from transcriberModel import transcriberModel

sys.path.append("%s/../../dataset" % os.path.dirname(__file__))
from makeDataset import getImageDataset
from makeDataset import getNumbersDataset

import argparse

parser = argparse.ArgumentParser()
parser.add_argument("--epoch", help="Epoch", type=int, required=False, default=25)
parser.add_argument(
    "--image", help="Test image number", type=int, required=False, default=0
)
args = parser.parse_args()

# Set up the model and load the weights at the chosen epoch
transcriber = transcriberModel()
weights_dir = ("%s/ML_ATB2/models/deep_convolutional_transcriber/" + "Epoch_%04d") % (
    os.getenv("SCRATCH"),
    args.epoch - 1,
)
load_status = transcriber.load_weights("%s/ckpt" % weights_dir)
# Check the load worked
load_status.assert_existing_objects_matched()

# Get test case number args.image
testImage = getImageDataset(purpose="test", nImages=args.image + 1)
testImage = testImage.batch(1)
originalImage = next(itertools.islice(testImage, args.image, args.image + 1))
testNumbers = getNumbersDataset(purpose="test", nImages=args.image + 1)
testNumbers = testNumbers.batch(1)
originalNumbers = next(itertools.islice(testNumbers, args.image, args.image + 1))

# Run that test image through the transcriber
encoded = transcriber.predict_on_batch(originalImage)

# Plot original image on the left - make an image from the encoded numbers
#  on the right
fig = Figure(
    figsize=(16.34, 10.56),
    dpi=100,
    facecolor="white",
    edgecolor="black",
    linewidth=0.0,
    frameon=False,
    subplotpars=None,
    tight_layout=None,
)
canvas = FigureCanvas(fig)
# Paint the background white - why is this needed?
ax_full = fig.add_axes([0, 0, 1, 1])
ax_full.set_xlim([0, 1])
ax_full.set_ylim([0, 1])
ax_full.add_patch(
    matplotlib.patches.Rectangle((0, 0), 1, 1, fill=True, facecolor="white")
)

# Original
ax_original = fig.add_axes([0.02, 0.015, 0.47, 0.97])
ax_original.set_axis_off()
ax_original.matshow(tf.reshape(originalImage, [1024, 768, 3]))

# Plot encoded using same method as original plot
ax_encoded = fig.add_axes([0.51, 0.015, 0.47, 0.97])
ax_encoded.set_xlim([0, 1])
ax_encoded.set_ylim([0, 1])
ax_encoded.set_axis_off()
imp = {
    "scale": 1.0,
    "xscale": 1.0,
    "yscale": 1.0,
    "xshift": 0.0,  # pixels, +ve right
    "yshift": 0.0,  # pixels, +ve up
    "rotate": 0.0,  # degrees clockwise
    "linewidth": 1.0,
    "bgcolour": (1.0, 1.0, 1.0),
    "fgcolour": (0.0, 0.0, 0.0),
    "yearHeight": 0.066,  # Fractional height of year row
    "totalsHeight": 0.105,  # Fractional height of totals row
    "monthsWidth": 0.137,  # Fractional width of months row
    "meansWidth": 0.107,  # Fractional width of means row
    "fontSize": 10,
    "year": 1941,
}
ax_encoded.add_patch(
    matplotlib.patches.Rectangle((0, 0), 1, 1, fill=True, facecolor="white")
)

# Box with the data in
topLeft = (0.07 + imp["xshift"] / 768, 0.725 + imp["yshift"] / 1024)
topRight = (
    0.93 + imp["xshift"] / 768 + (imp["xscale"] - 1) * 0.86,
    0.725 + imp["yshift"] / 1024,
)
bottomLeft = (0.07 + imp["xshift"] / 768, 0.325 + imp["yshift"] / 1024)
bottomRight = (
    0.93 + imp["xshift"] / 768 + (imp["xscale"] - 1) * 0.86,
    0.325 + imp["yshift"] / 1024 - (imp["yscale"] - 1) * 0.4,
)
ax_encoded.add_line(
    Line2D(
        xdata=(topLeft[0], topRight[0], bottomRight[0], bottomLeft[0], topLeft[0]),
        ydata=(topLeft[1], topRight[1], bottomRight[1], bottomLeft[1], topLeft[1]),
        linestyle="solid",
        linewidth=imp["linewidth"],
        color=imp["fgcolour"],
        zorder=1,
    )
)


def topAt(x):  # x is fraction along top line
    return (
        topRight[0] * x + topLeft[0] * (1 - x),
        topRight[1] * x + topLeft[1] * (1 - x),
    )


def bottomAt(x):
    return (
        bottomRight[0] * x + bottomLeft[0] * (1 - x),
        bottomRight[1] * x + bottomLeft[1] * (1 - x),
    )


def leftAt(y):  # y is fraction of way from bottom to top
    return (
        topLeft[0] * y + bottomLeft[0] * (1 - y),
        topLeft[1] * y + bottomLeft[1] * (1 - y),
    )


def rightAt(y):
    return (
        topRight[0] * y + bottomRight[0] * (1 - y),
        topRight[1] * y + bottomRight[1] * (1 - y),
    )


# Draw the grid
lft = leftAt(1.0 - imp["yearHeight"])
rgt = rightAt(1.0 - imp["yearHeight"])
ax_encoded.add_line(
    Line2D(
        xdata=(lft[0], rgt[0]),
        ydata=(lft[1], rgt[1]),
        linestyle="solid",
        linewidth=imp["linewidth"],
        color=imp["fgcolour"],
        zorder=1,
    )
)
lft = leftAt(imp["totalsHeight"])
rgt = rightAt(imp["totalsHeight"])
ax_encoded.add_line(
    Line2D(
        xdata=(lft[0], rgt[0]),
        ydata=(lft[1], rgt[1]),
        linestyle="solid",
        linewidth=imp["linewidth"],
        color=imp["fgcolour"],
        zorder=1,
    )
)
tp = topAt(imp["monthsWidth"])
bm = bottomAt(imp["monthsWidth"])
ax_encoded.add_line(
    Line2D(
        xdata=(tp[0], bm[0]),
        ydata=(tp[1], bm[1]),
        linestyle="solid",
        linewidth=imp["linewidth"],
        color=imp["fgcolour"],
        zorder=1,
    )
)
tp = topAt(1.0 - imp["meansWidth"])
bm = bottomAt(1.0 - imp["meansWidth"])
ax_encoded.add_line(
    Line2D(
        xdata=(tp[0], bm[0]),
        ydata=(tp[1], bm[1]),
        linestyle="solid",
        linewidth=imp["linewidth"],
        color=imp["fgcolour"],
        zorder=1,
    )
)
for yrl in range(1, 10):
    x = imp["monthsWidth"] + yrl * (1.0 - imp["meansWidth"] - imp["monthsWidth"]) / 10
    tp = topAt(x)
    bm = bottomAt(x)
    ax_encoded.add_line(
        Line2D(
            xdata=(tp[0], bm[0]),
            ydata=(tp[1], bm[1]),
            linestyle="solid",
            linewidth=imp["linewidth"],
            color=imp["fgcolour"],
            zorder=1,
        )
    )
# Add the fixed text
tp = topAt(imp["monthsWidth"] / 2)
lft = leftAt(1.0 - imp["yearHeight"] / 2)
ax_encoded.text(
    tp[0],
    lft[1],
    "Year",
    fontsize=imp["fontSize"],
    horizontalalignment="center",
    verticalalignment="center",
)
tp = topAt(1.0 - imp["meansWidth"] / 2)
lft = leftAt(1.0 - imp["yearHeight"] / 2)
ax_encoded.text(
    tp[0],
    lft[1],
    "Means",
    fontsize=imp["fontSize"],
    horizontalalignment="center",
    verticalalignment="center",
)
tp = topAt(imp["monthsWidth"] / 2)
lft = leftAt(imp["totalsHeight"] / 2)
ax_encoded.text(
    tp[0],
    lft[1],
    "Totals",
    fontsize=imp["fontSize"],
    horizontalalignment="center",
    verticalalignment="center",
)
months = (
    "January",
    "February",
    "March",
    "April",
    "May",
    "June",
    "July",
    "August",
    "September",
    "October",
    "November",
    "December",
)
tp = topAt(imp["monthsWidth"] / 10)
for mdx in range(len(months)):
    lft = leftAt(
        1.0
        - imp["yearHeight"]
        - (mdx + 1)
        * (1.0 - imp["yearHeight"] - imp["totalsHeight"])
        / (len(months) + 1)
    )
    ax_encoded.text(
        tp[0],
        lft[1],
        months[mdx],
        fontsize=imp["fontSize"] - 1,
        horizontalalignment="left",
        verticalalignment="center",
    )
lft = leftAt(1.0 - imp["yearHeight"] / 2)
for ydx in range(10):
    x = (
        imp["monthsWidth"]
        + (ydx + 0.5) * (1.0 - imp["meansWidth"] - imp["monthsWidth"]) / 10
    )
    tp = topAt(x)
    ax_encoded.text(
        tp[0],
        lft[1],
        "%04d" % (imp["year"] + ydx),
        fontsize=imp["fontSize"],
        horizontalalignment="center",
        verticalalignment="center",
    )

# Add the transcribed numbers
orig = originalNumbers
trnb = encoded
tidx = 0
for yri in range(10):
    x = (
        imp["monthsWidth"]
        + (yri + 0.5) * (1.0 - imp["meansWidth"] - imp["monthsWidth"]) / 10
    )
    tp = topAt(x)
    for mni in range(12):
        lft = leftAt(
            1.0
            - imp["yearHeight"]
            - (mni + 1)
            * (1.0 - imp["yearHeight"] - imp["totalsHeight"])
            / (len(months) + 1)
        )
        for dgi in range(3):
            originalDigit = numpy.where(orig[0, tidx, :] == 1.0)[0]
            dgProbabilities = trnb[0, tidx, :]
            bestTranscribed = numpy.where(
                dgProbabilities == numpy.amax(dgProbabilities)
            )[0]
            colour = "red"
            if bestTranscribed == originalDigit:
                colour = "blue"
            ax_encoded.text(
                tp[0] - 0.015 + dgi * 0.015,
                lft[1],
                "%1d" % bestTranscribed,
                fontsize=imp["fontSize"],
                horizontalalignment="center",
                verticalalignment="center",
                color=colour,
            )
            tidx += 1
# Add the monthly means
tp = topAt(1.0 - imp["meansWidth"] / 2)
for mni in range(12):
    lft = leftAt(
        1.0
        - imp["yearHeight"]
        - (mni + 1)
        * (1.0 - imp["yearHeight"] - imp["totalsHeight"])
        / (len(months) + 1)
    )
    for dgi in range(3):
        originalDigit = numpy.where(orig[0, tidx, :] == 1.0)[0]
        dgProbabilities = trnb[0, tidx, :]
        bestTranscribed = numpy.where(dgProbabilities == numpy.amax(dgProbabilities))[0]
        colour = "red"
        if bestTranscribed == originalDigit:
            colour = "blue"
        ax_encoded.text(
            tp[0] - 0.015 + dgi * 0.015,
            lft[1],
            "%1d" % bestTranscribed,
            fontsize=imp["fontSize"],
            horizontalalignment="center",
            verticalalignment="center",
            color=colour,
        )
        tidx += 1
# Add the annual totals
lft = leftAt(imp["totalsHeight"] / 2)
for yri in range(10):
    x = (
        imp["monthsWidth"]
        + (yri + 0.5) * (1.0 - imp["meansWidth"] - imp["monthsWidth"]) / 10
    )
    tp = topAt(x)
    inr = 0.0
    for dgi in range(4):
        originalDigit = numpy.where(orig[0, tidx, :] == 1.0)[0]
        dgProbabilities = trnb[0, tidx, :]
        bestTranscribed = numpy.where(dgProbabilities == numpy.amax(dgProbabilities))[0]
        colour = "red"
        if bestTranscribed == originalDigit:
            colour = "blue"
        ax_encoded.text(
            tp[0] - 0.0225 + dgi * 0.015,
            lft[1],
            "%1d" % bestTranscribed,
            fontsize=imp["fontSize"],
            horizontalalignment="center",
            verticalalignment="center",
            color=colour,
        )
        tidx += 1

# Render the figure as a png
fig.savefig("compare.png")