Transcription accuracy by digit
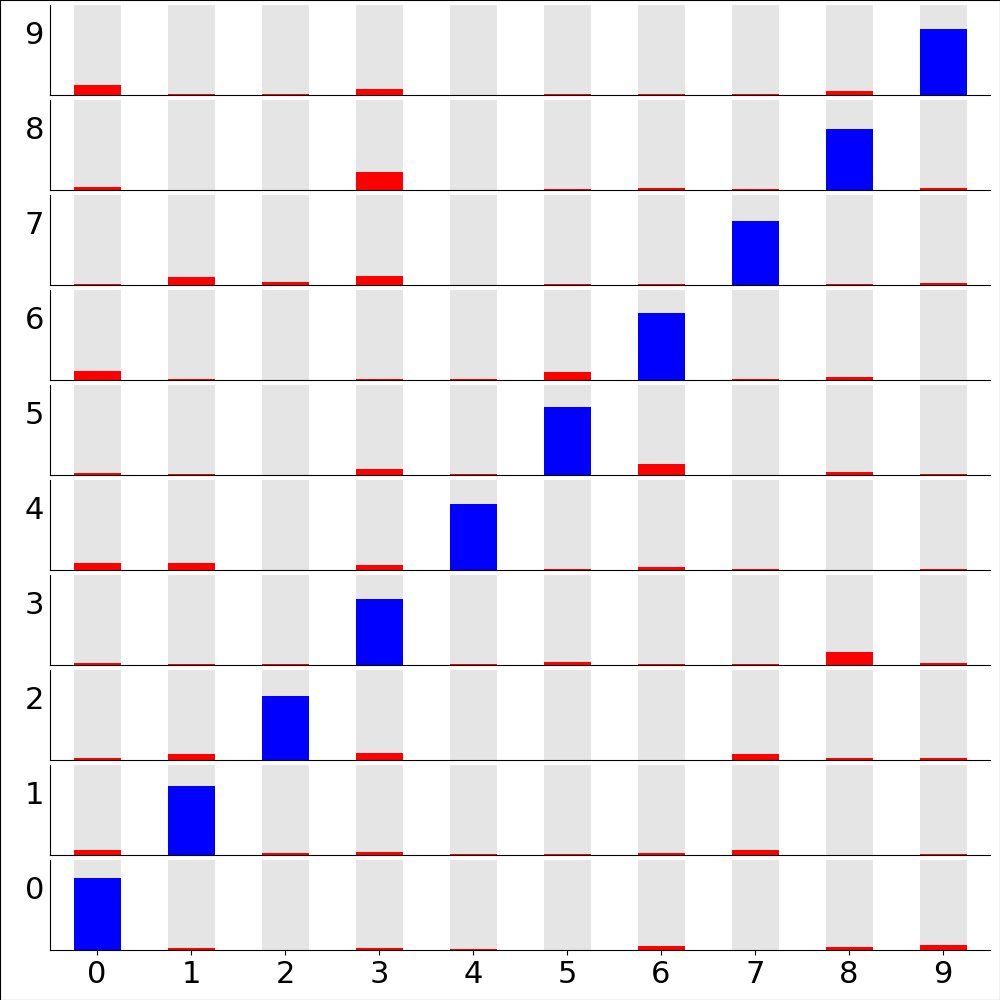
Probability distribution of digits from the test dataset, as transcribed by the deep-convolutional transcriber after 200 epochs training. Partitioned by correct answer (vertical axis) and transcribed value (horizontal axis). That is, the bottom left are digits that are really ‘0’ and are transcribed as ‘0’, bottom right - digits that are really ‘0’ but are transcribed as ‘9’, top left - digits that are really ‘9’ but are transcribed as ‘0’, …
Code to make figure
#!/usr/bin/env python

# Probability matrix

import os
import sys

import tensorflow as tf
import numpy
import itertools

import matplotlib
from matplotlib.backends.backend_agg import FigureCanvasAgg as FigureCanvas
from matplotlib.figure import Figure
from matplotlib.patches import Rectangle
from matplotlib.lines import Line2D

sys.path.append("%s/../" % os.path.dirname(__file__))
from transcriberModel import transcriberModel

sys.path.append("%s/../../dataset" % os.path.dirname(__file__))
from makeDataset import getImageDataset
from makeDataset import getNumbersDataset

import argparse

parser = argparse.ArgumentParser()
parser.add_argument("--epoch", help="Epoch", type=int, required=False, default=25)
# Set nimages to a small number for fast testing
parser.add_argument(
    "--nimages",
    help="No of test cases to look at",
    type=int,
    required=False,
    default=None,
)
args = parser.parse_args()

# Set up the model and load the weights at the chosen epoch
transcriber = transcriberModel()
weights_dir = ("%s/ML_ATB2/models/deep_convolutional_transcriber/" + "Epoch_%04d") % (
    os.getenv("SCRATCH"),
    args.epoch - 1,
)
load_status = transcriber.load_weights("%s/ckpt" % weights_dir)
# Check the load worked
load_status.assert_existing_objects_matched()

# Make the probability matrix
testImages = getImageDataset(purpose="test", nImages=args.nimages)
testNumbers = getNumbersDataset(purpose="test", nImages=args.nimages)
testData = tf.data.Dataset.zip((testImages, testNumbers))
count = numpy.zeros(10)
pmatrix = numpy.zeros((10, 10))
for testCase in testData:
    image = testCase[0]
    orig = testCase[1]
    encoded = transcriber(tf.reshape(image, [1, 1024, 768, 3]), training=False)
    for tidx in range(orig.shape[0]):
        originalDigit = numpy.where(orig[tidx, :] == 1.0)[0]
        dgProbabilities = encoded[0, tidx, :]
        pmatrix[originalDigit, :] += dgProbabilities
        count[originalDigit] += 1
pmatrix /= count

# Plot a bar chart of transcription probabilities for a single digit
def plot1(ax, d):
    for td in range(10):
        fc = "red"
        if td == d:
            fc = "blue"
        ax.add_patch(
            matplotlib.patches.Rectangle(
                (td - 0.25, 0), 0.5, 1, fill=True, facecolor=(0, 0, 0, 0.1)
            )
        )
        ax.add_patch(
            matplotlib.patches.Rectangle(
                (td - 0.25, 0), 0.5, pmatrix[d, td], fill=True, facecolor=fc
            )
        )


# Plot the histogram for all 10 target digits
fig = Figure(
    figsize=(10, 10),
    dpi=100,
    facecolor="white",
    edgecolor="black",
    linewidth=0.0,
    frameon=False,
    subplotpars=None,
    tight_layout=None,
)
matplotlib.rcParams.update({"font.size": 22})
canvas = FigureCanvas(fig)
# Paint the background white - why is this needed?
ax_full = fig.add_axes([0, 0, 1, 1])
ax_full.set_xlim([0, 1])
ax_full.set_ylim([0, 1])
ax_full.add_patch(
    matplotlib.patches.Rectangle((0, 0), 1, 1, fill=True, facecolor="white")
)

for td in range(10):
    ax_digit = fig.add_axes([0.05, 0.05 + (td * 0.1) * 0.95, 0.94, 0.09])
    ax_digit.set_xlim([-0.5, 9.5])
    ax_digit.set_ylim([0, 1])
    ax_digit.spines["top"].set_visible(False)
    ax_digit.spines["right"].set_visible(False)
    if td != 0:
        ax_digit.get_xaxis().set_ticks([])
    else:
        ax_digit.get_xaxis().set_ticks(range(10))
        # ax_digit.set_xlabel("Transcribed choice")
    ax_digit.get_yaxis().set_ticks([])
    ax_digit.set_ylabel("%1d  " % td, rotation=0)
    plot1(ax_digit, td)

# Render the figure as a png
fig.savefig("pvp.png")