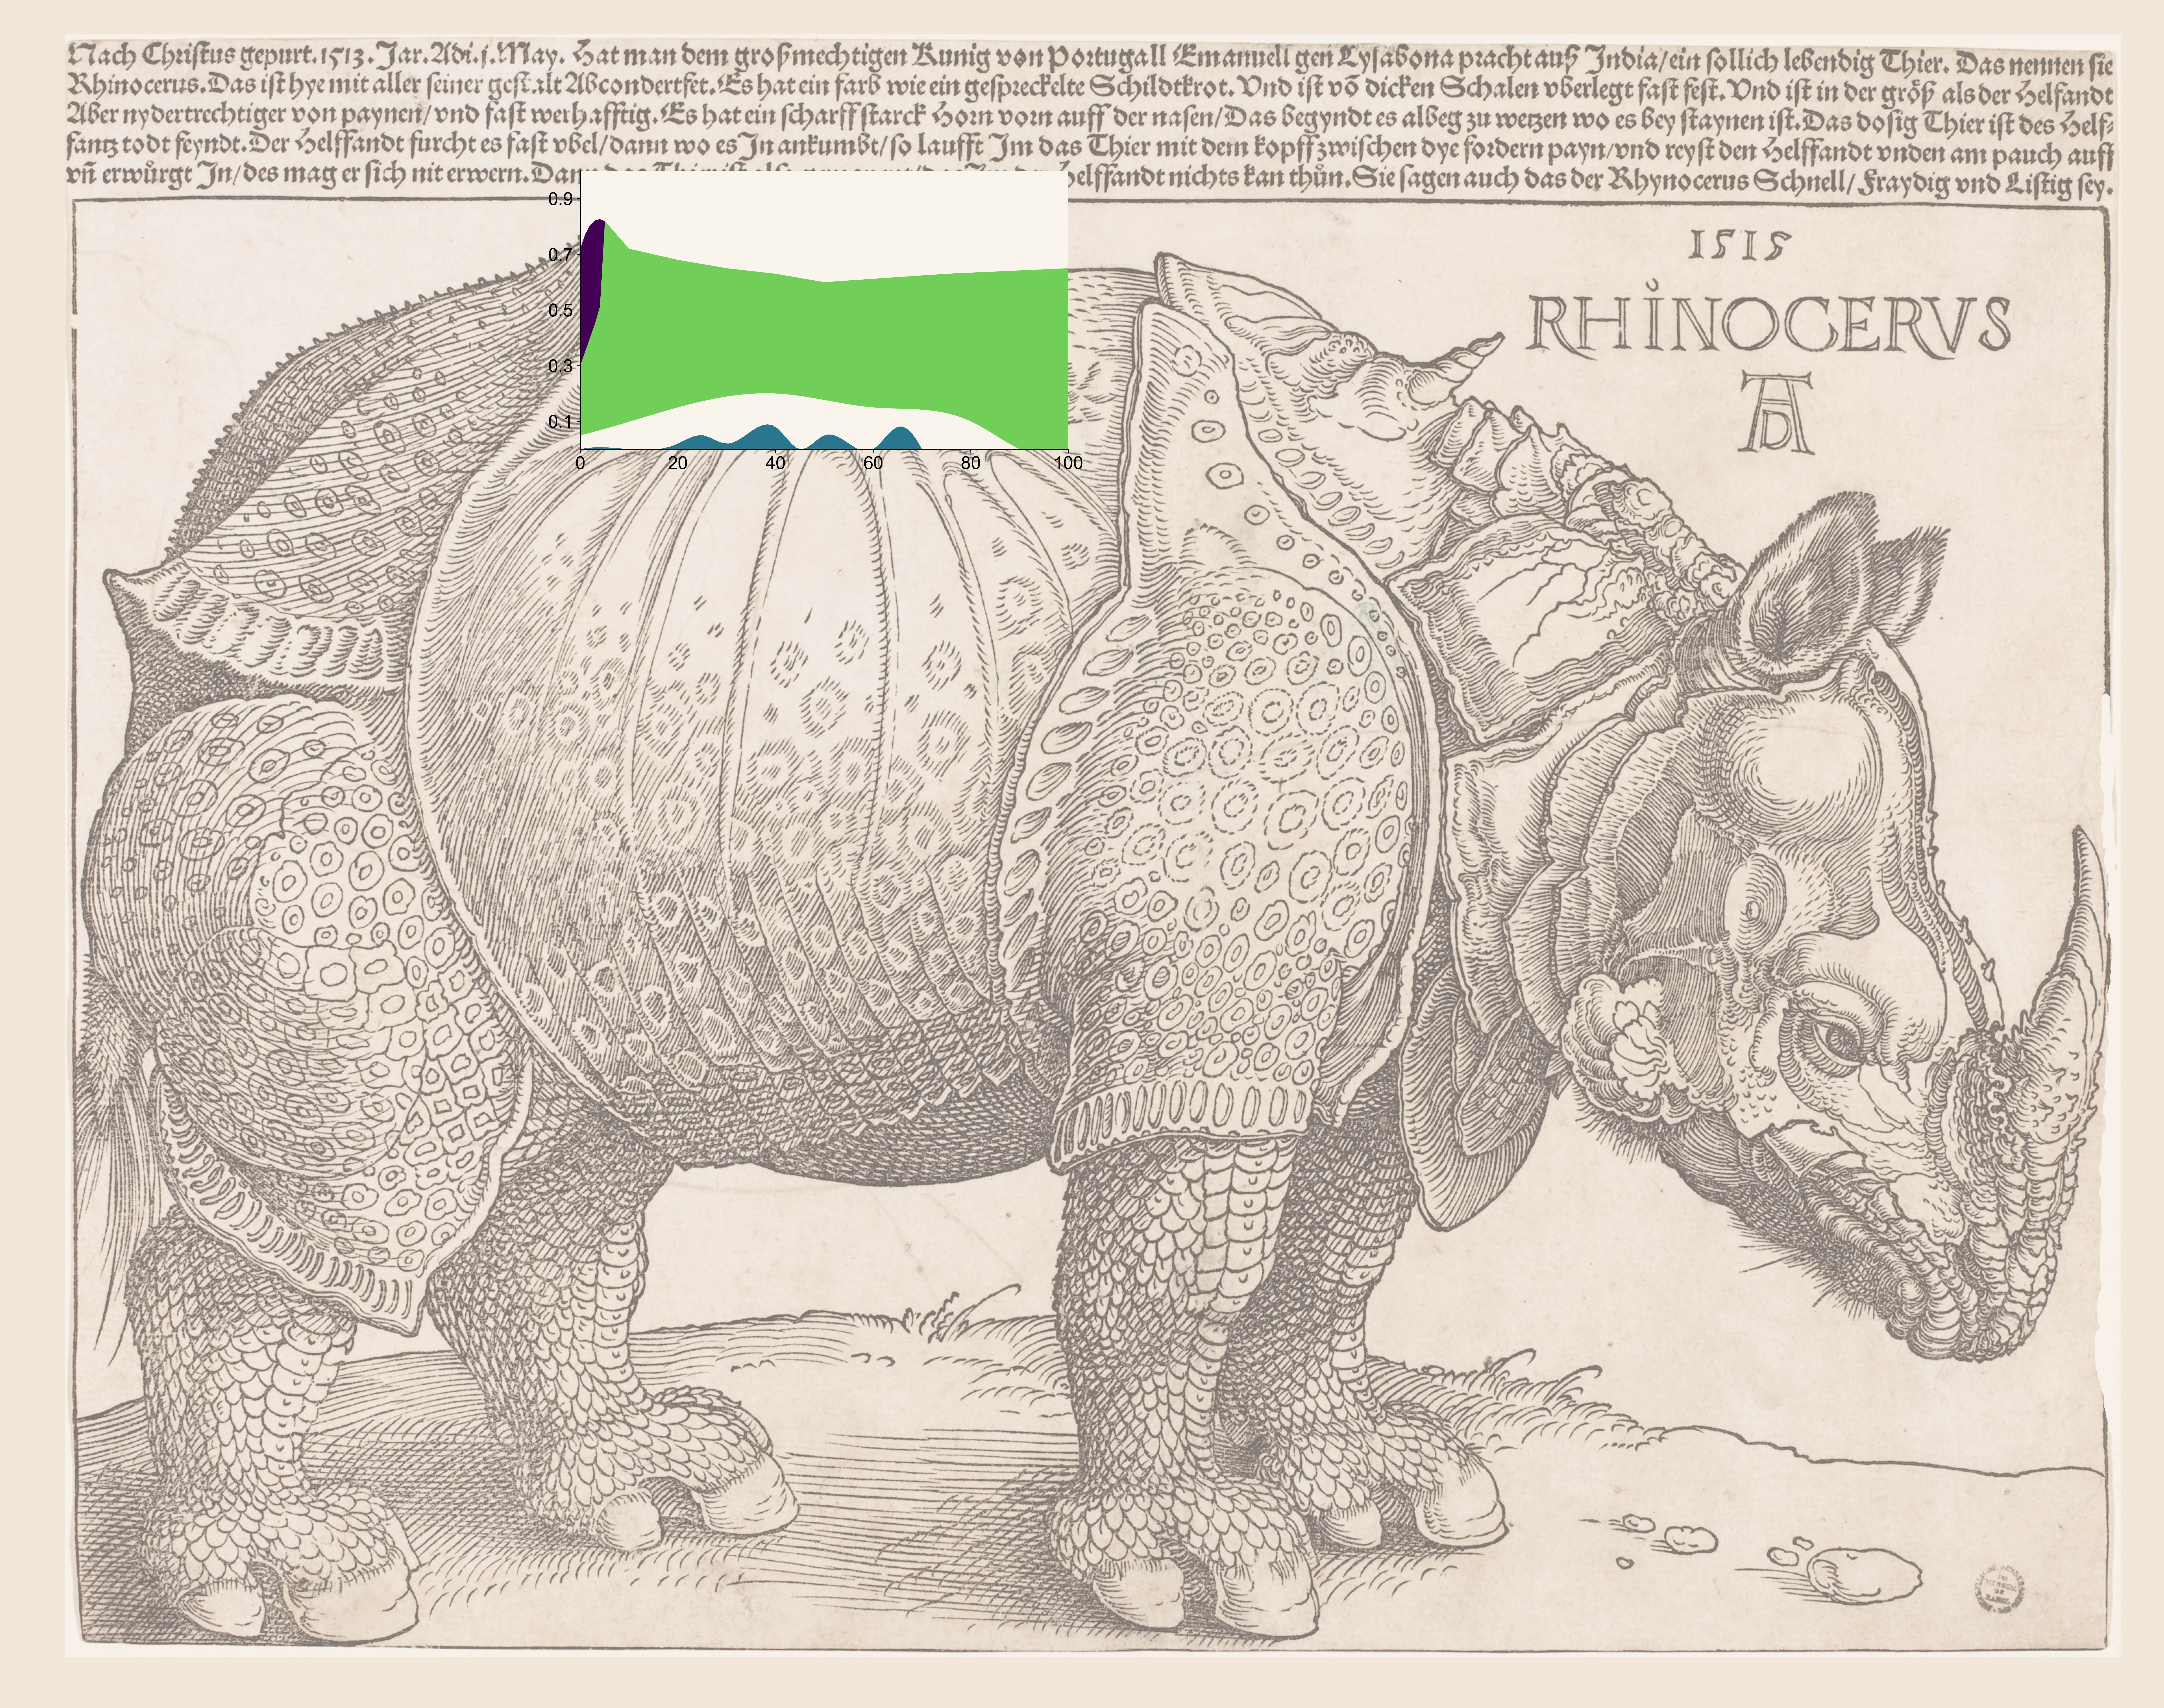
Rhinoceros: Top Centre-Left panel

The top centre-left panel uses a stackplot.
# function to plot the contents of the Top Centre-Left panel

from utils import smoothLine, colours
import numpy as np


def pTCL(fig, gspec):
    ax_TCL = fig.add_subplot(
        gspec,
        frameon=True,
        xlim=[0, 100],
        xticks=[0, 20, 40, 60, 80, 100],
        ylim=[0, 1],
        yticks=[0.1, 0.3, 0.5, 0.7, 0.9],
    )
    ax_TCL.set_facecolor(colours["ax_bg"])
    ax_TCL.spines["right"].set_visible(False)
    ax_TCL.spines["top"].set_visible(False)
    # Line points matched to original
    line_TCL1 = smoothLine(
        np.array(
            [
                [0, 0.0],
                [10, 0.0],
                [20, 0.02],
                [25, 0.05],
                [30, 0.02],
                [40, 0.08],
                [45, 0.0],
                [50, 0.05],
                [60, 0.0],
                [65, 0.08],
                [70, 0.0],
                [100, 0.0],
            ]
        )
    )
    line_TCL2 = smoothLine(
        np.array(
            [
                [0, 0.05],
                [20, 0.15],
                [40, 0.2],
                [60, 0.15],
                [80, 0.1],
                [90, 0.0],
                [100, 0.0],
            ]
        )
    )
    line_TCL3 = smoothLine(
        np.array(
            [
                [0, 0.3],
                [2, 0.4],
                [4, 0.5],
                [5, 0.82],
                [10, 0.72],
                [20, 0.68],
                [30, 0.65],
                [40, 0.63],
                [50, 0.6],
                [75, 0.63],
                [100, 0.65],
            ]
        ),
        k=1,
    )
    line_TCL4 = smoothLine(
        np.array(
            [
                [0, 0.72],
                [5, 0.82],
                [10, 0.72],
                [20, 0.68],
                [30, 0.65],
                [40, 0.63],
                [50, 0.6],
                [75, 0.63],
                [100, 0.65],
            ]
        )
    )
    line_TCL4[:, 1][line_TCL4[:, 0] > 5] = line_TCL3[:, 1][line_TCL3[:, 0] > 5]
    ax_TCL.stackplot(
        line_TCL1[:, 0],
        line_TCL1[:, 1],
        line_TCL2[:, 1] - line_TCL1[:, 1],
        line_TCL3[:, 1] - line_TCL2[:, 1],
        line_TCL4[:, 1] - line_TCL3[:, 1],
        colors=[
            colours["blue"],
            colours["ax_bg"],
            colours["green"],
            colours["purple"],
        ],
        alpha=1.0,
    )
    return ax_TCL
