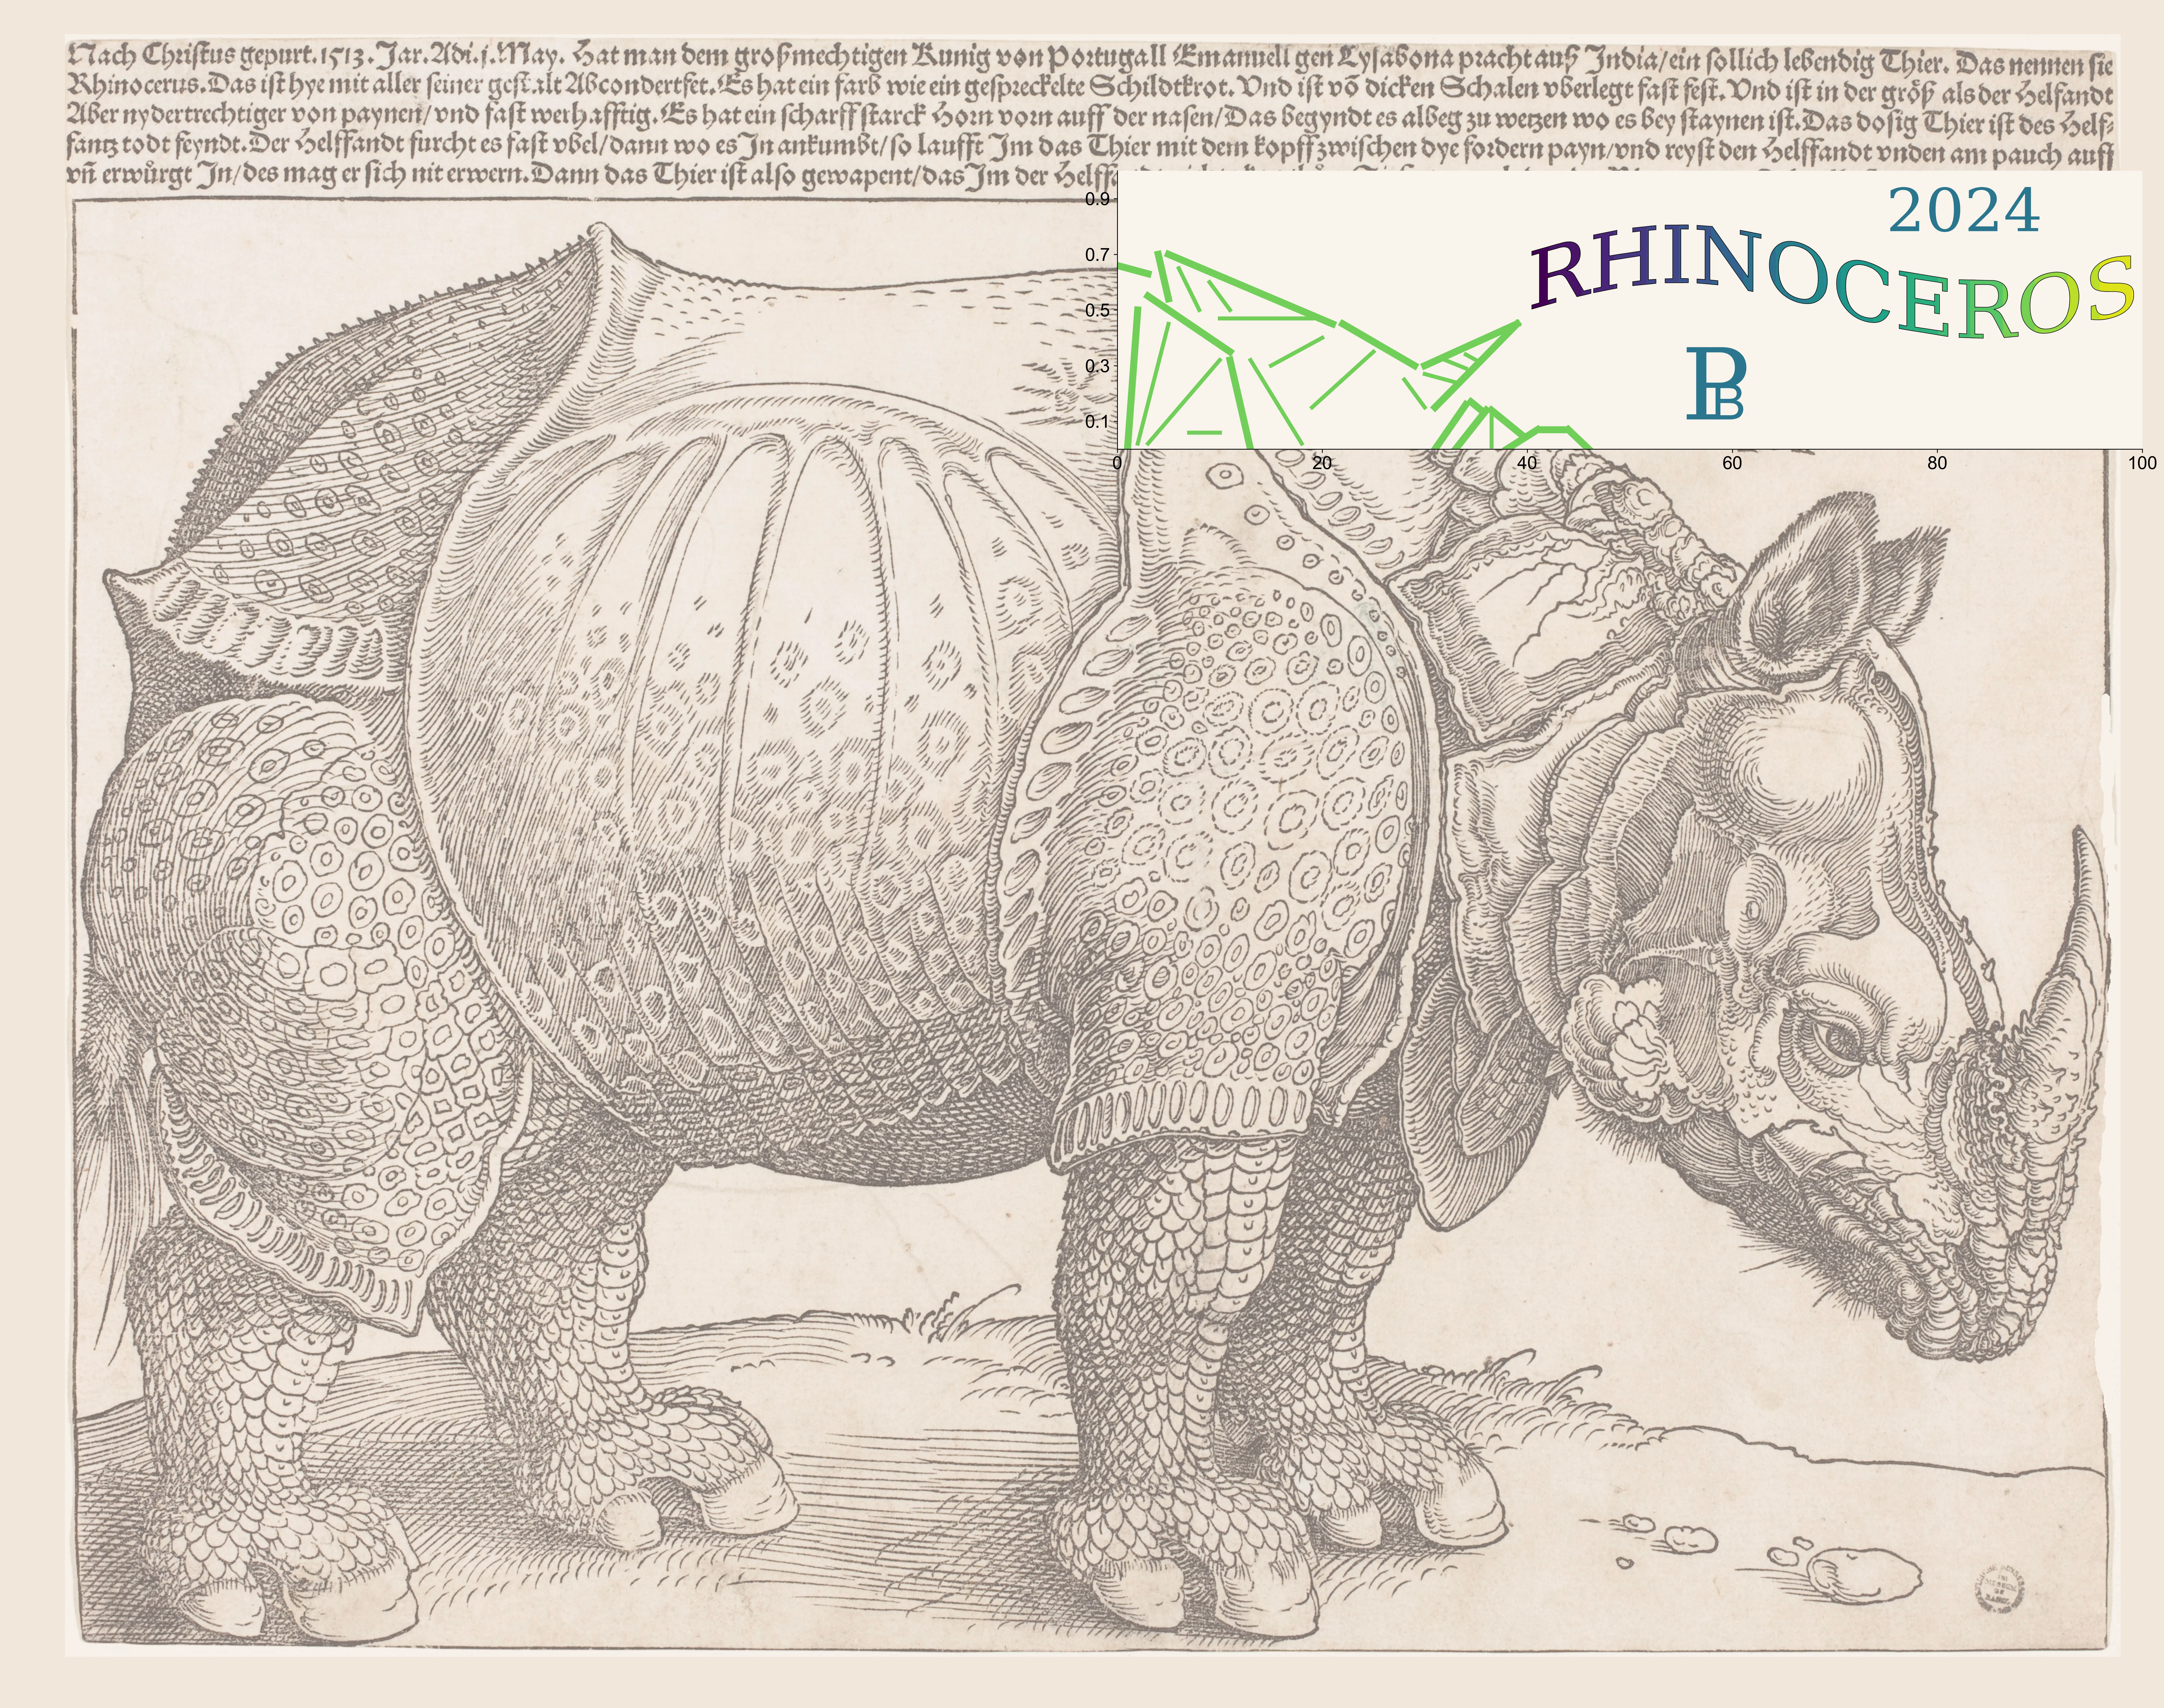
Rhinoceros: Top Centre-Right & Right panel

The top centre-right & right panel uses line plots for the outline and TextPaths for the label, date, and monogram.
# function to plot the contents of the Top Right and Centre-Right panel

from utils import smoothLine, colours, viridis
import numpy as np
from matplotlib.textpath import TextPath
from matplotlib.patches import PathPatch
from matplotlib.transforms import Affine2D
from matplotlib.patches import Polygon


def pTCR_TR(fig, gspec):
    ax_TCR_TR = fig.add_subplot(
        gspec,
        frameon=True,
        xlim=[0, 100],
        xticks=[0, 20, 40, 60, 80, 100],
        ylim=[0, 1],
        yticks=[0.1, 0.3, 0.5, 0.7, 0.9],
    )
    ax_TCR_TR.set_facecolor(colours["ax_bg"])
    ax_TCR_TR.spines["right"].set_visible(False)
    ax_TCR_TR.spines["top"].set_visible(False)

    # Straight line segments - heavy lines for outline
    x = np.array([[0, 3]]).T
    y = np.array([[0.66, 0.63]]).T

    x = np.concatenate([x, np.array([[1, 2], [3, 11], [11, 13]]).T], axis=1)
    y = np.concatenate([y, np.array([[0, 0.5], [0.55, 0.35], [0.32, 0]]).T], axis=1)

    x = np.concatenate([x, np.array([[5, 4], [5, 21], [22, 29]]).T], axis=1)
    y = np.concatenate([y, np.array([[0.54, 0.7], [0.7, 0.45], [0.45, 0.3]]).T], axis=1)

    x = np.concatenate([x, np.array([[30, 39], [39, 31]]).T], axis=1)
    y = np.concatenate([y, np.array([[0.3, 0.45], [0.45, 0.15]]).T], axis=1)

    x = np.concatenate([x, np.array([[31, 34], [34.5, 35.5]]).T], axis=1)
    y = np.concatenate([y, np.array([[0.0, 0.16], [0.17, 0.14]]).T], axis=1)

    x = np.concatenate([x, np.array([[33, 36], [36.5, 39.5]]).T], axis=1)
    y = np.concatenate([y, np.array([[0.0, 0.14], [0.14, 0.05]]).T], axis=1)

    x = np.concatenate([x, np.array([[38, 41], [41.5, 43.5], [44, 46]]).T], axis=1)
    y = np.concatenate(
        [y, np.array([[0.0, 0.07], [0.07, 0.07], [0.07, 0.0]]).T], axis=1
    )

    ax_TCR_TR.plot(x, y, color=colours["green"], linewidth=7)

    # - narrow lines as highlights
    x = np.array([[2, 5], [3, 10], [7, 10]]).T
    y = np.array([[0.02, 0.45], [0.02, 0.32], [0.06, 0.06]]).T

    x = np.concatenate([x, np.array([[6, 8], [9, 11]]).T], axis=1)
    y = np.concatenate([y, np.array([[0.65, 0.5], [0.6, 0.5]]).T], axis=1)

    x = np.concatenate([x, np.array([[10, 19], [15, 20], [19, 25]]).T], axis=1)
    y = np.concatenate(
        [y, np.array([[0.47, 0.47], [0.3, 0.4], [0.15, 0.35]]).T], axis=1
    )

    x = np.concatenate(
        [x, np.array([[28, 30], [30, 33], [32, 34], [34, 35]]).T], axis=1
    )
    y = np.concatenate(
        [y, np.array([[0.25, 0.15], [0.27, 0.24], [0.32, 0.29], [0.34, 0.32]]).T],
        axis=1,
    )

    x = np.concatenate([x, np.array([[13, 18], [36.5, 36.5]]).T], axis=1)
    y = np.concatenate([y, np.array([[0.32, 0.02], [0.13, 0.01]]).T], axis=1)

    ax_TCR_TR.plot(x, y, color=colours["green"], linewidth=4)

    # Add the title on a curved path
    path = TextPath((40, 14), "RHINOCEROS", size=8, prop="Serif")
    transform = Affine2D().scale(sx=1, sy=0.0356)
    path = transform.transform_path(path)
    path.vertices.setflags(write=1)
    Vx, Vy = path.vertices[:, 0], path.vertices[:, 1]
    nVx = 2 * np.pi * (Vx - Vx.min()) / (Vx.max() - Vx.min())
    Vy += 0.1 * np.sin(nVx)
    step = (100 - 40) / 20
    for tcolor in np.linspace(40, 100, 20):
        patch = PathPatch(
            path,
            facecolor=viridis((tcolor - 40) / 60),
            edgecolor="black",
            linewidth=0.5,
        )
        patch.set_clip_path(
            Polygon(
                [
                    [tcolor - 1, 0],
                    [tcolor + step, 0],
                    [tcolor + step, 1],
                    [tcolor - 1, 1],
                ],
                transform=ax_TCR_TR.transData,
            )
        )
        ax_TCR_TR.add_artist(patch)

    # Add date
    path = TextPath((75, 22), "2024", size=6, prop="Serif")
    transform = Affine2D().scale(sx=1, sy=0.0356)
    path = transform.transform_path(path)
    patch = PathPatch(
        path, facecolor=colours["blue"], edgecolor=colours["blue"], linewidth=0
    )
    ax_TCR_TR.add_artist(patch)

    # Add Logotype
    path = TextPath((55, 3), "P", size=10, prop="Serif")
    transform = Affine2D().scale(sx=1, sy=0.0356)
    path = transform.transform_path(path)
    patch = PathPatch(
        path, facecolor=colours["blue"], edgecolor=colours["blue"], linewidth=0
    )
    ax_TCR_TR.add_artist(patch)
    path = TextPath((58, 3), "B", size=5, prop="Sans")
    transform = Affine2D().scale(sx=1, sy=0.0356)
    path = transform.transform_path(path)
    patch = PathPatch(path, facecolor=colours["blue"], linewidth=0)
    ax_TCR_TR.add_artist(patch)

    return ax_TCR_TR
