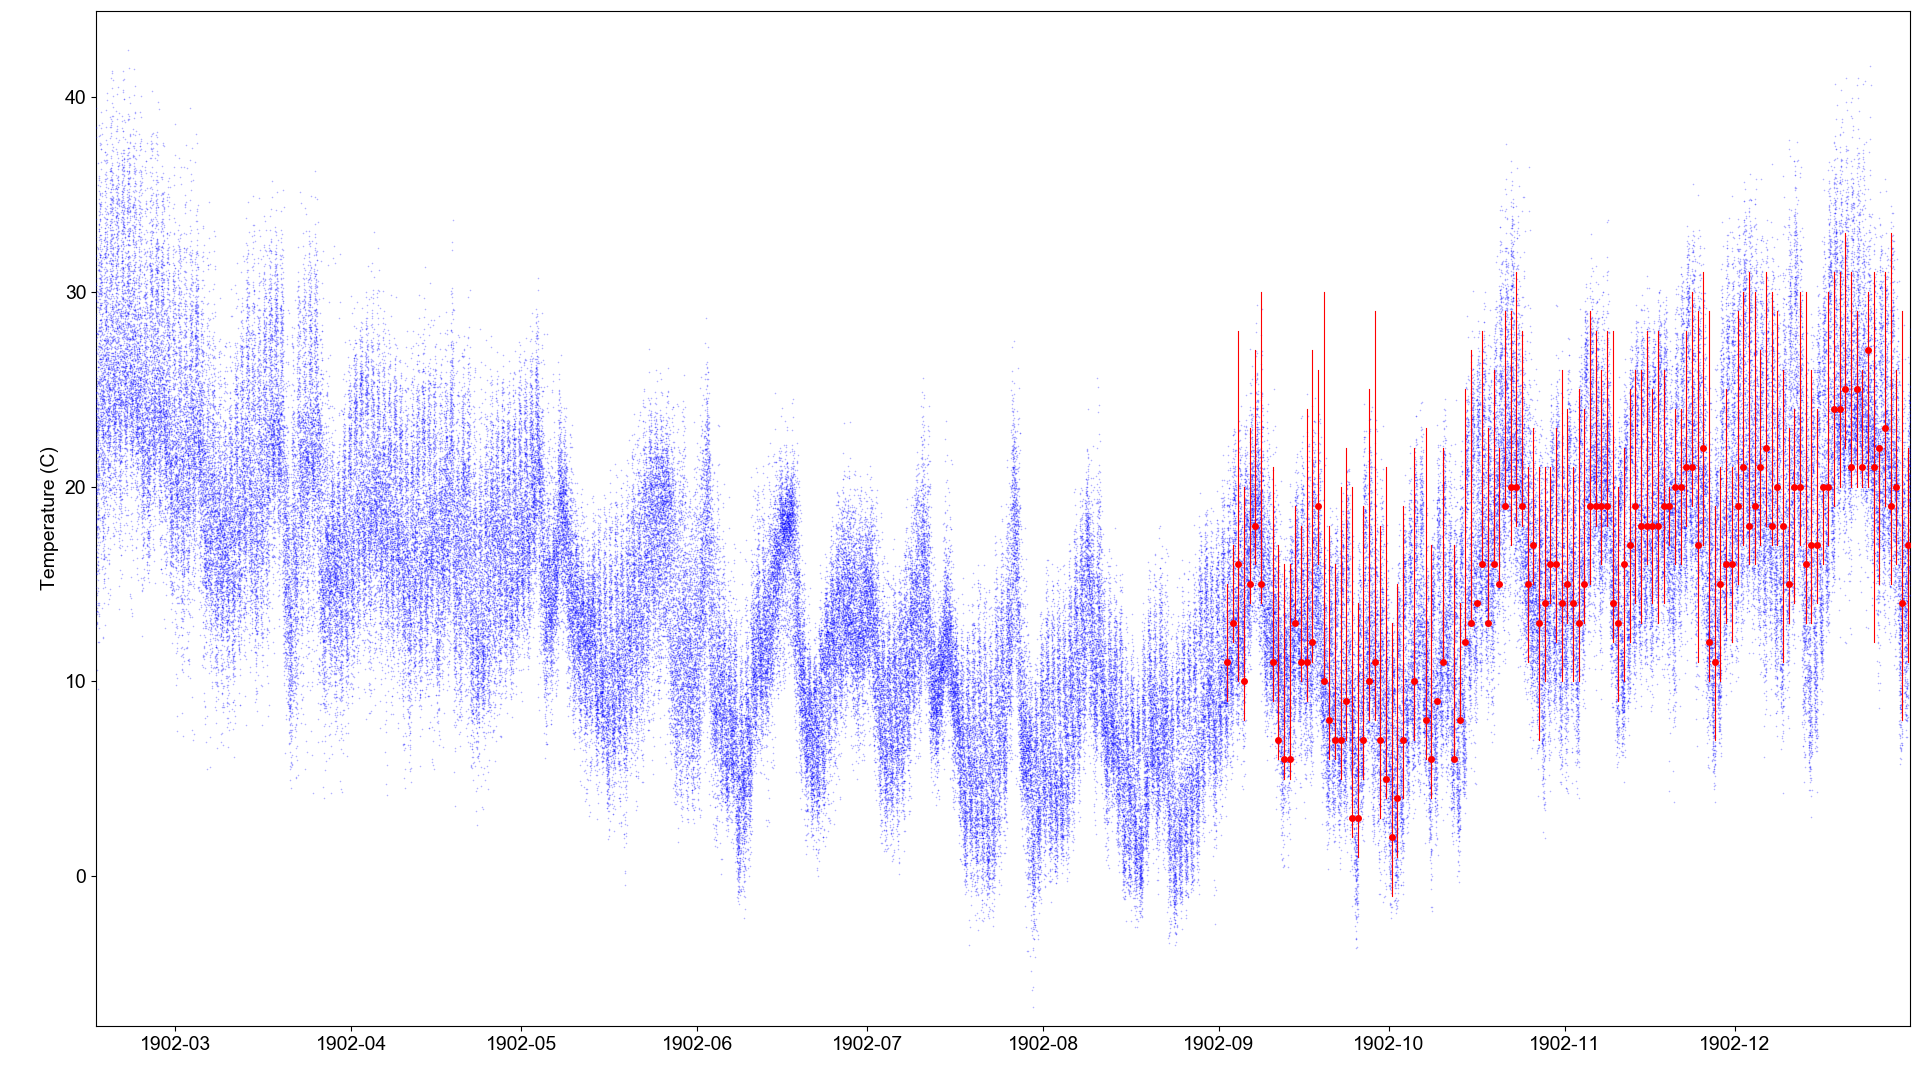
DWR_Zarate (Comparison with 20CRv3 Temperature)

Blue dots are the 20CRv3 2m air temperature ensemble at the location of the station (80 ensemble members, with data every three hours). Red dots are the station observations. (Once a day, at 14:00 local up to August, at 7:00 local from September 1st). Red lines join the station Tmax and Tmin observations at the same times.
Code to make the figure
#!/usr/bin/env python

# Plot a comparison of AT for the Argentine DWR stations with 20CRv3

# Requires 20CR data to have already been extracted with get_comparators.py

import os
import pickle
import SEF
import datetime
import numpy

import matplotlib
from matplotlib.backends.backend_agg import \
                 FigureCanvasAgg as FigureCanvas
from matplotlib.figure import Figure

import argparse
parser = argparse.ArgumentParser()
parser.add_argument("--id", help="Station to compare",
                    type=str,required=True)
args = parser.parse_args()

pickled_20CRdata_dir="%s/sef_comparators/Argentinian_DWR/" % os.getenv('SCRATCH')

# Load the obs
known_bad=False
obs_file="../../../../sef/Argentinian_DWR/1902/%s_T.tsv" % args.id
obs_Tmax_file="../../../../sef/Argentinian_DWR/1902/%s_Tmax.tsv" % args.id
obs_Tmin_file="../../../../sef/Argentinian_DWR/1902/%s_Tmin.tsv" % args.id
if not os.path.isfile(obs_file):
    known_bad=True
    obs_file="../../../../sef/Argentinian_DWR/known_bad/1902/%s_T.tsv" % args.id
    obs_Tmax_file="../../../../sef/Argentinian_DWR/known_bad/1902/%s_Tmax.tsv" % args.id
    obs_Tmin_file="../../../../sef/Argentinian_DWR/known_bad/1902/%s_Tmin.tsv" % args.id
obs=SEF.read_file(obs_file)
obs_Tmax=SEF.read_file(obs_Tmax_file)
obs_Tmin=SEF.read_file(obs_Tmin_file)

# load the pickled 20CR data
rdata={}
rmax=0.0
rmin=1000000.0
start_day=datetime.datetime(1902, 2, 1, 0)
end_day  =datetime.datetime(1902,12,31, 0)
current_day=start_day
while current_day<=end_day:
    for hour in (0,3,6,9,12,15,18,21):
        pfile="%s/%04d/%02d/%02d/%02d/%s_air.2m.pkl" % (pickled_20CRdata_dir,
                                                       current_day.year,
                                                       current_day.month,
                                                       current_day.day,
                                                       hour,args.id)
        fh=open(pfile,'rb')
        nrd=pickle.load(fh)-273.15
        fh.close()
        rmax=max(rmax,max(nrd))
        rmin=min(rmin,min(nrd))
        rdata["%04d%02d%02d%02d" % (current_day.year,current_day.month,
                                    current_day.day,hour)]=nrd
    current_day=current_day+datetime.timedelta(days=1)

# Set up the plot
aspect=16.0/9.0
fig=Figure(figsize=(10.8*aspect,10.8),  # Width, Height (inches)
           dpi=100,
           facecolor=(0.88,0.88,0.88,1),
           edgecolor=None,
           linewidth=0.0,
           frameon=False,
           subplotpars=None,
           tight_layout=None)
canvas=FigureCanvas(fig)
font = {'family' : 'sans-serif',
        'sans-serif' : 'Arial',
        'weight' : 'normal',
        'size'   : 14}
matplotlib.rc('font', **font)

# Single axes - var v. time
ax=fig.add_axes([0.05,0.05,0.945,0.94])
# Axes ranges from data
ax.set_xlim(datetime.datetime(1902, 2,15,0),
            datetime.datetime(1902,12,31,23))
ax.set_ylim(min(rmin,min(obs['Data']['Value'])-273.15)-1,
            max(rmax,max(obs['Data']['Value'])-273.15)+1)
ax.set_ylabel('Temperature (C)')

# Ensemble values - one point for each member at each time-point
t_jitter=numpy.random.uniform(low=-6,high=6,size=80)
for key in rdata:
    dtime=datetime.datetime(int(key[0:4]),int(key[4:6]),int(key[6:8]),
                            int(key[8:10]))
    ensemble=rdata[key] # in hPa
    dates=[dtime+datetime.timedelta(hours=t) for t in t_jitter]
    ax.scatter(dates,ensemble,
                    5,
                    'blue', # Color
                    marker='.',
                    edgecolors='black',
                    linewidths=0.0,
                    alpha=0.3,
                    zorder=50)

# Observations
for index, row in obs['Data'].iterrows():
    if row['Value'] != row['Value']: continue  # Missing data
    dte=datetime.datetime(row['Year'],row['Month'],row['Day'],int(row['HHMM']/100),
                             row['HHMM']%100)
    ax.scatter(dte,row['Value']-273.15,
                    100,
                    'red', # Color
                    marker='.',
                    edgecolors='red',
                    linewidths=0.0,
                    alpha=1.0,
                    zorder=100)
    if obs_Tmin['Data']['Value'][index] != obs_Tmin['Data']['Value'][index]: continue  # Missing data
    ax.add_line(matplotlib.lines.Line2D(
                               xdata=(dte,dte),
                               ydata=(row['Value']-273.15,obs_Tmin['Data']['Value'][index]-273.15),
                               linestyle='solid',
                               linewidth=0.8,
                               color=(1,0,0,1.0),
                               zorder=100))
    if obs_Tmax['Data']['Value'][index] != obs_Tmax['Data']['Value'][index]: continue  # Missing data
    ax.add_line(matplotlib.lines.Line2D(
                               xdata=(dte,dte),
                               ydata=(row['Value']-273.15,obs_Tmax['Data']['Value'][index]-273.15),
                               linestyle='solid',
                               linewidth=0.8,
                               color=(1,0,0,1.0),
                               zorder=100))

figfile='figures/T_comparison/%s.png' % args.id
if known_bad:
    figfile='figures/known_bad/T_comparison/%s.png' % args.id
fig.savefig(figfile)
This script requires pre-extracted 20CRv3 data:
