Observations coverage (ISPD4.7)
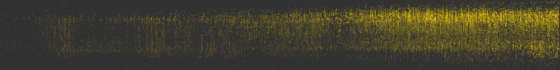
This is a static, poster version of this video. The idea is to show the change in observations coverage with time.
The vertical axis is latitude (90S to 90N at 1 degree resolution), the horizontal axis is time (Jan 1836 to Dec 2015, at 1 month resolution), each vertical line is at a randomly sampled 1-degree of longitude. The points are bright yellow if the corresponding lat:lon:month contains more observations than analysis periods (more than one observation/6 hours), pale yellow if it has some observations but fewer than one per analysis period, and dark grey if it contains no observations.
Code to make the poster
Script to download the observations:
#!/usr/bin/env python

# Retrieve all the v3 observations files from NERSC

import datetime
import IRData.twcr as twcr

for year in range(1836,2016):
    twcr.fetch('observations',datetime.datetime(year,1,1),version='3')
Script to extract the observations at each sampled degree of lon:month. This is very slow to run, and should be parallelised, but I don’t expect to run it again anytime soon so I haven’t bothered.
#!/usr/bin/env python

# For each month in 1836-2015, pick a random 1-degree longitude band
#  and get all the observations in that band for that month.

import datetime
import IRData.twcr as twcr
import pickle
import pandas
import numpy
import os
#import os.path

def next_month(dt0):
    dt1 = dt0.replace(day=1)
    dt2 = dt1 + datetime.timedelta(days=32)
    dt3 = dt2.replace(day=1)
    return dt3

obs=[]
for year in range(1836,2015):
    for month in range(1,13):
        fname= "%s/ISPD_poster/%04d/%02d.pkl" % (os.getenv('SCRATCH'),
                                                 year,month)
        if os.path.exists(fname): continue
        sdate = datetime.datetime(year,month,1,0,0)
        edate = next_month(sdate)
        m_ob = twcr.load_observations(sdate,edate,version='3')
        rand_l = numpy.random.randint(0,360)
        longs=numpy.array(m_ob['Longitude'])
        lats=numpy.array(m_ob['Latitude'])
        w=((numpy.isfinite(longs)) & (numpy.isfinite(lats)) &
                    (longs>=rand_l) & (longs <(rand_l+1)) &
                    (lats>=-90) & (lats <=90))
        s_ob = m_ob[w]
        fname= "%s/ISPD_poster/%04d/%02d.pkl" % (os.getenv('SCRATCH'),
                                                 year,month)
        if not os.path.isdir(os.path.dirname(fname)):
            os.makedirs(os.path.dirname(fname))
        pickle.dump( s_ob, open( fname, "wb" ) )
Script to plot the poster:
#!/usr/bin/env python

# Make a poster showing ISPD4.7 obs coverage.

import os
import numpy
import datetime

import iris
import matplotlib
from matplotlib.backends.backend_agg import FigureCanvasAgg as FigureCanvas
from matplotlib.figure import Figure
from matplotlib.patches import Rectangle

import pickle

def next_month(dt0):
    dt1 = dt0.replace(day=1)
    dt2 = dt1 + datetime.timedelta(days=32)
    dt3 = dt2.replace(day=1)
    return dt3

start_year=1836
end_year = 2015

# Plot the images
fig=Figure(figsize=(72,9),              # Width, Height (inches)
           dpi=300,
           facecolor=(0.5,0.5,0.5,1),
           edgecolor=None,
           linewidth=0.0,
           frameon=False,                # Don't draw a frame
           subplotpars=None,
           tight_layout=None)
# Attach a canvas
canvas=FigureCanvas(fig)
matplotlib.rc('image',aspect='auto')


#ax.add_patch(Rectangle((xmin,ymin),width,height,
#                        facecolor='#708090',fill=True,zorder=1))

xmin=datetime.datetime(start_year,1,1,0)-datetime.timedelta(days=30)
xmax=datetime.datetime(end_year,12,13,23)+datetime.timedelta(days=120)
width=xmax-xmin
ymin=-90
ymax=90
height=ymax-ymin

# For each month, load and plot the observations
def y_to_j(y):
    return numpy.minimum(height-1,numpy.maximum(0,
            numpy.floor((y-ymin)/(ymax-ymin)*(height-1)))).astype(int)

n_obs=numpy.zeros([(end_year+1-start_year)*12,180])
px=[]
for year in range(start_year,end_year+1):
    for month in range(1,13):
        m_count = (year-start_year)*12 + month-1
        px.append(datetime.datetime(year,month,15))
        fname= "%s/ISPD_poster/%04d/%02d.pkl" % (os.getenv('SCRATCH'),
                                                 year,month)
        s_ob = pickle.load( open( fname, "rb" ) )
        sdate = datetime.datetime(year,month,1,0,0)
        edate = next_month(sdate)
        n_steps = int((edate-sdate).total_seconds()/(3600*6))
        lats=numpy.array(s_ob['Latitude'])
        lat_i=y_to_j(lats)
        for i in range(len(lat_i)):
            n_obs[m_count,lat_i[i]] += 1
        n_obs[m_count,:] /= n_steps

s=n_obs.shape
ax2 = fig.add_axes([0,0,1,1],facecolor='green')
ax2.set_axis_off() # Don't want surrounding x and y axis
nd2=numpy.random.rand(s[1],s[0])
clrs=[]
for shade in numpy.linspace(.22+.01,.16+.01):
    clrs.append((shade,shade,shade,1))
y = numpy.linspace(0,1,s[1])
x = numpy.linspace(0,1,s[0])
img = ax2.pcolormesh(x,y,nd2,
                        cmap=matplotlib.colors.ListedColormap(clrs),
                        alpha=1.0,
                        shading='gouraud',
                        zorder=10)

ax = fig.add_axes([0,0,1,1],facecolor='black')
ax.set_axis_off() # Don't want surrounding x and y axis

ax.set_xlim(xmin,xmax)
ax.set_ylim(ymin,ymax)
ax.set_aspect('auto')
# Plot the observations locations
for i in range(s[0]):
    for j in range(s[1]):
        if n_obs[i,j]==0: continue
        scale=min(1.0,max(0.25,numpy.sqrt(n_obs[i,j])))
        s_colour=(.19*(1-scale)+1*scale,
                  .19*(1-scale)+0.84*scale,
                  .19*(1-scale)+0*scale,
                  1)
        ax.add_patch(Rectangle((px[i],j/(s[1]+2)*height+ymin+1),
                               datetime.timedelta(days=31),
                               (height/180),
                               facecolor=s_colour,
                               edgecolor=s_colour,
                               linewidth=0.001,
                               fill=True,
                               zorder=100,
                               alpha=1))


fig.savefig('ISPD.pdf')