ERA5 T2m - validate the trained VAE
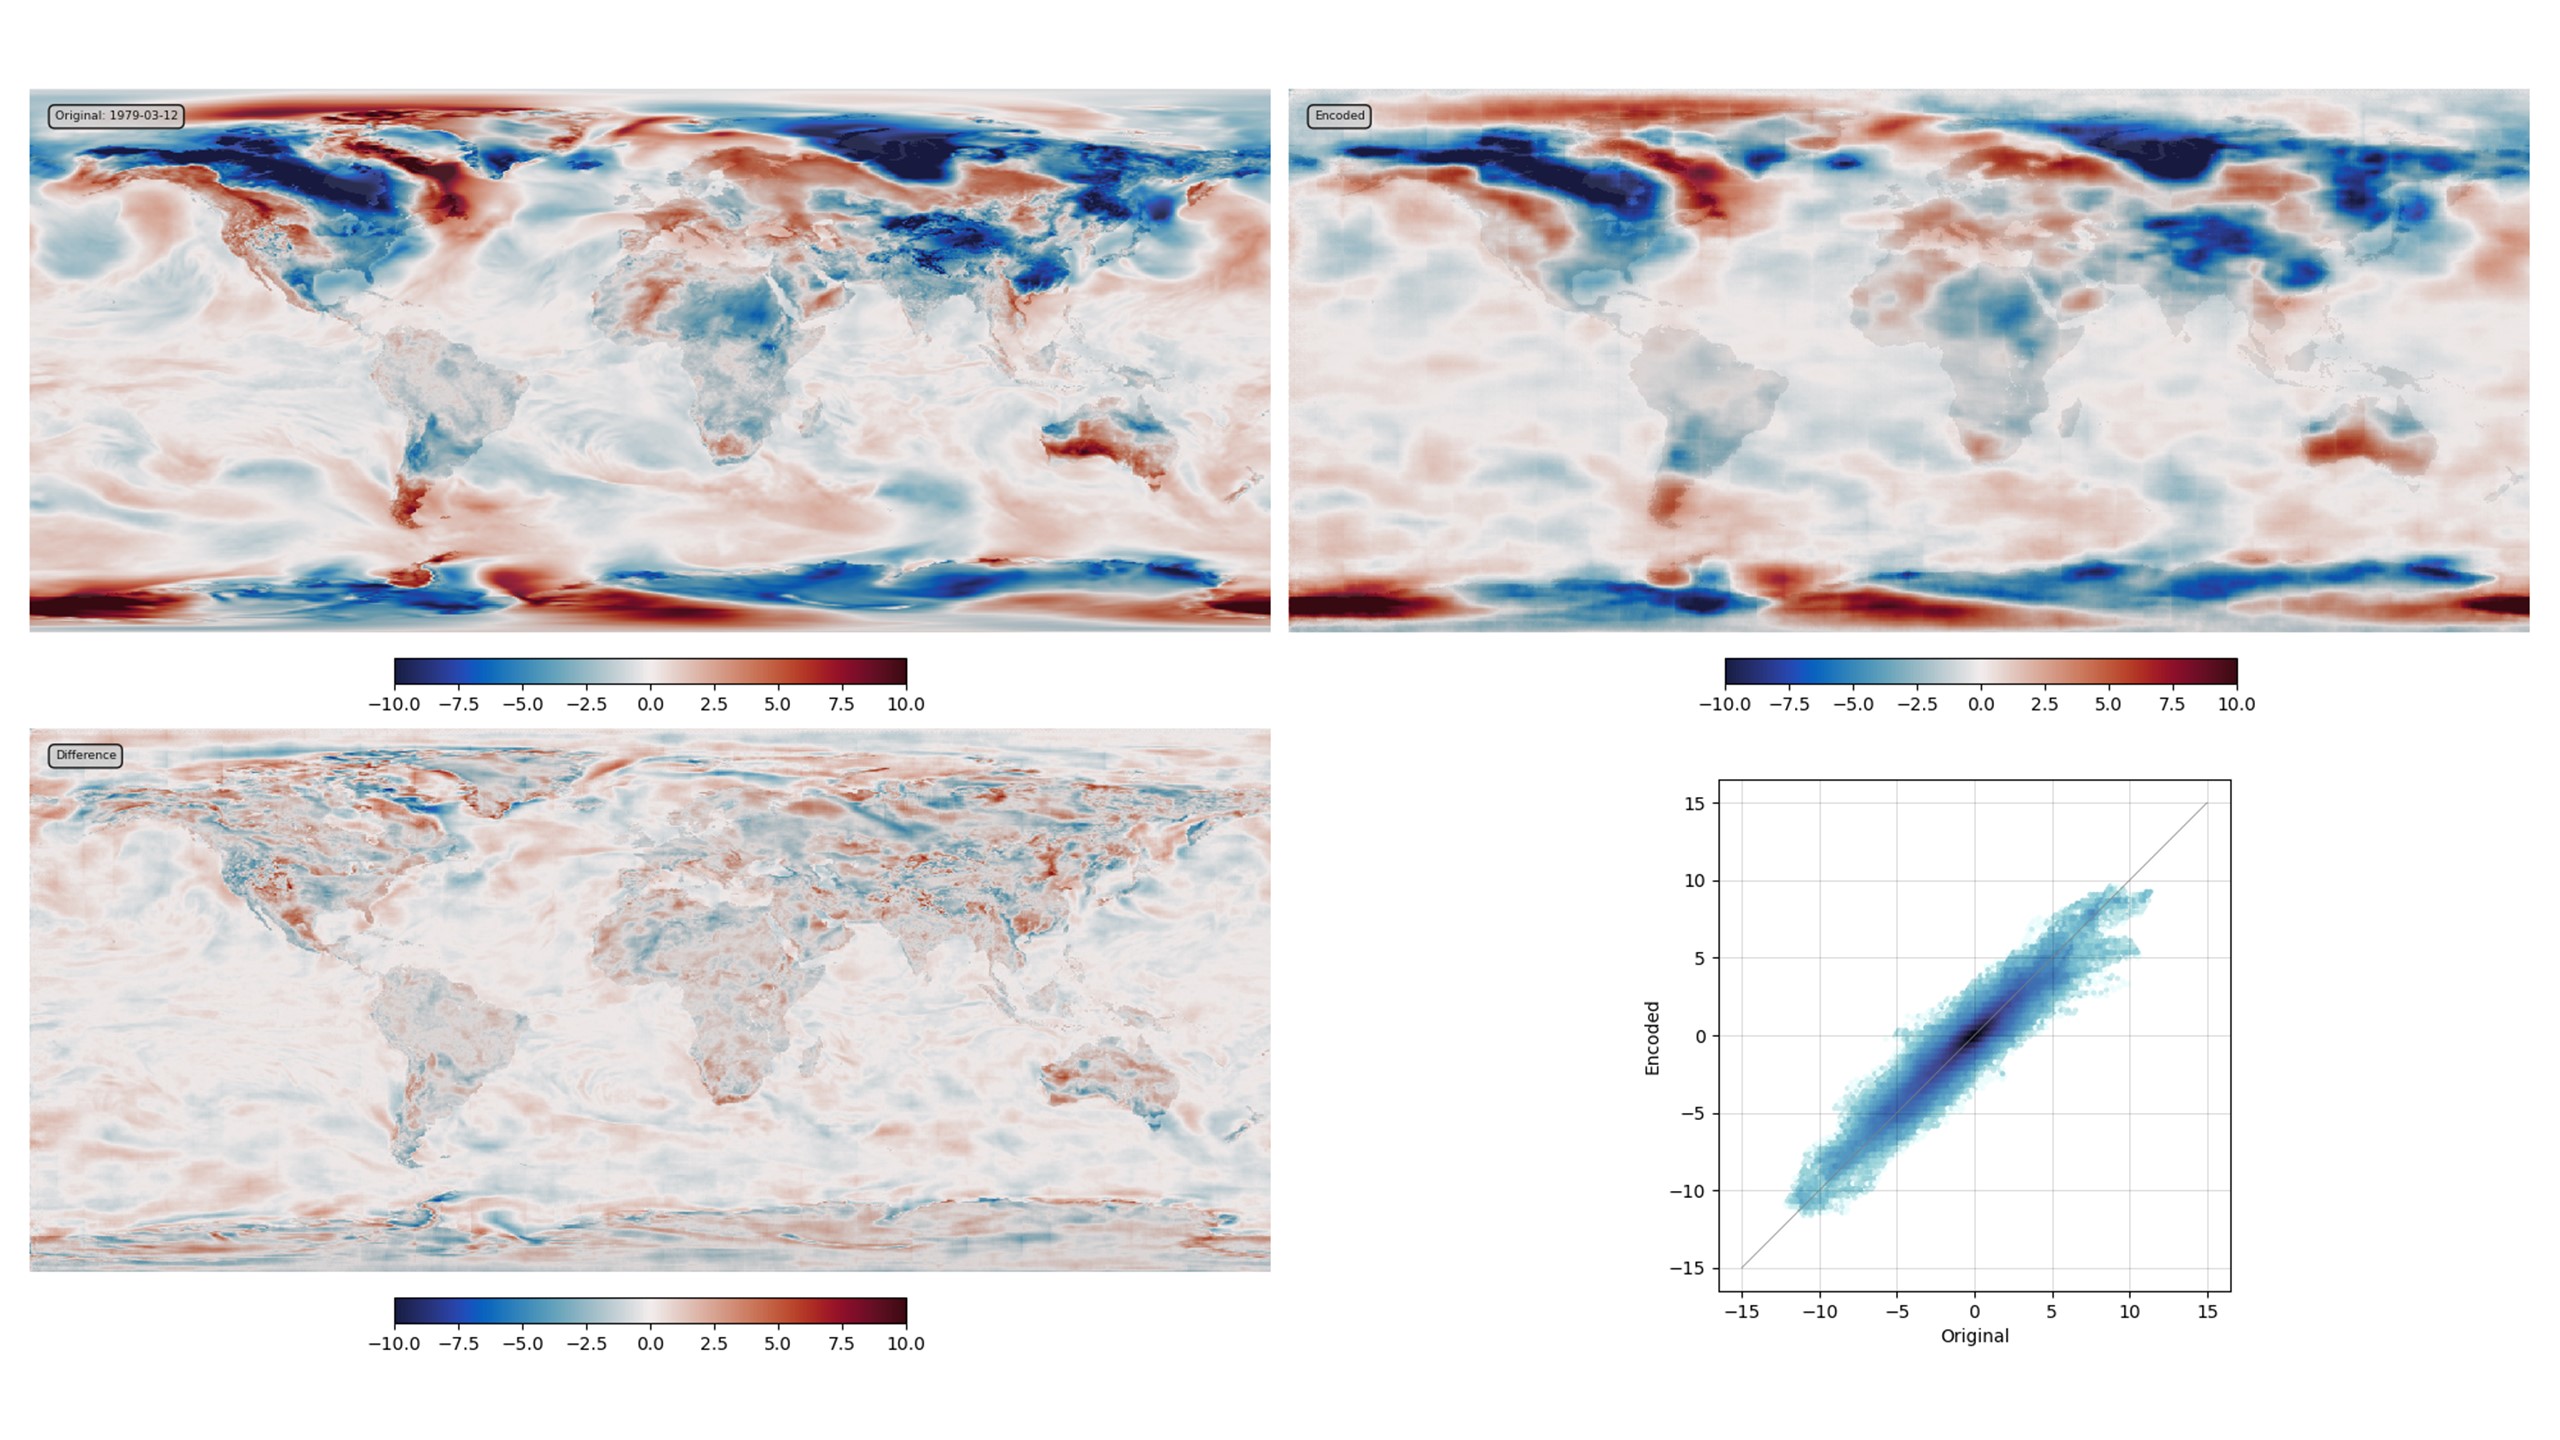
VAE validation: top left - original field, top right - generator output, bottom left - difference, bottom right - scatter original::output. (Note that a substantially better result could be produced with more model-building effort and a larger latent space, but this is good enough for present purposes).
Script to make the validation figure
#!/usr/bin/env python

# Plot a validation figure for the autoencoder.

# Fir components
#  1) Original field
#  2) Encoded field
#  3) Difference field
#  4) Original:Encoded scatter
#

import tensorflow as tf
import os
import sys
import numpy as np

import matplotlib
from matplotlib.backends.backend_agg import FigureCanvasAgg as FigureCanvas
from matplotlib.figure import Figure

import argparse

parser = argparse.ArgumentParser()
parser.add_argument("--epoch", help="Epoch", type=int, required=True)
parser.add_argument("--year", type=int, required=False, default=1979)
parser.add_argument("--month", type=int, required=False, default=3)
parser.add_argument("--day", type=int, required=False, default=12)
args = parser.parse_args()


sys.path.append(
    "%s/../../../data/prepare_training_tensors_ERA5_T2m" % os.path.dirname(__file__)
)
from ERA5_load import ERA5_load_T2m
from ERA5_load import ERA5_load_T2m_climatology
from ERA5_load import ERA5_roll_longitude
from ERA5_load import ERA5_trim

# Make the input tensor for the specified date
t = ERA5_load_T2m(args.year, args.month, args.day)
c = ERA5_load_T2m_climatology(args.year, args.month, args.day)
t = t - c
t /= 15
t += 0.5
t = ERA5_roll_longitude(t)
t = ERA5_trim(t)
t_in = tf.convert_to_tensor(t.data, np.float32)
t_in = tf.reshape(t_in, [1, 720, 1440, 1])

sys.path.append("%s/." % os.path.dirname(__file__))
from plot_ERA5_comparison import get_land_mask
from plot_ERA5_comparison import plot_T2m
from plot_ERA5_comparison import plot_scatter
from plot_ERA5_comparison import plot_colourbar

# Define the model
sys.path.append("%s/.." % os.path.dirname(__file__))
from autoencoderModel import DCVAE

autoencoder = DCVAE()
weights_dir = ("%s/Proxy_20CR/models/DCVAE_single_ERA5_T2m/" + "Epoch_%04d") % (
    os.getenv("SCRATCH"),
    args.epoch,
)
load_status = autoencoder.load_weights("%s/ckpt" % weights_dir).expect_partial()
# Check the load worked
load_status.assert_existing_objects_matched()

# Make encoded version
encoded = tf.convert_to_tensor(autoencoder.predict_on_batch(t_in), np.float32)

# Make the figure
lm = get_land_mask()

fig = Figure(
    figsize=(20, 10),
    dpi=100,
    facecolor=(0.88, 0.88, 0.88, 1),
    edgecolor=None,
    linewidth=0.0,
    frameon=False,
    subplotpars=None,
    tight_layout=None,
)
canvas = FigureCanvas(fig)

ax_global = fig.add_axes([0, 0, 1, 1], facecolor="white")
ax_global.set_axis_off()
ax_global.autoscale(enable=False)
ax_global.fill((-0.1, 1.1, 1.1, -0.1), (-0.1, -0.1, 1.1, 1.1), "white")

# Top left - original field
ax_of = fig.add_axes([0.01, 0.565, 0.485, 0.425])
ax_of.set_aspect("auto")
ax_of.set_axis_off()
ofp = plot_T2m(
    ax_of,
    tf.squeeze(t_in - 0.5).numpy() * 15,
    vMin=-10,
    vMax=10,
    land=lm,
    label="Original: %04d-%02d-%02d" % (args.year, args.month, args.day),
)
ax_ocb = fig.add_axes([0.05, 0.525, 0.405, 0.02])
plot_colourbar(fig, ax_ocb, ofp)

# Top right - encoded field
ax_of = fig.add_axes([0.502, 0.565, 0.485, 0.425])
ax_of.set_aspect("auto")
ax_of.set_axis_off()
ofp = plot_T2m(
    ax_of,
    tf.squeeze(encoded - 0.5).numpy() * 15,
    vMin=-10,
    vMax=10,
    land=lm,
    label="Encoded",
)
ax_ocb = fig.add_axes([0.57, 0.525, 0.405, 0.02])
plot_colourbar(fig, ax_ocb, ofp)

# Bottom left - difference field
ax_of = fig.add_axes([0.01, 0.065, 0.485, 0.425])
ax_of.set_aspect("auto")
ax_of.set_axis_off()
ofp = plot_T2m(
    ax_of,
    tf.squeeze(encoded - t_in).numpy() * 15,
    vMin=-10,
    vMax=10,
    land=lm,
    label="Difference",
)
ax_ocb = fig.add_axes([0.05, 0.025, 0.405, 0.02])
plot_colourbar(fig, ax_ocb, ofp)

# Bottom right - scatterplot

ax_scatter = fig.add_axes([0.67, 0.05, 0.2, 0.4])
plot_scatter(ax_scatter, t_in.numpy(), encoded.numpy(), d_max=15, d_min=-15)


fig.savefig("comparison.png")
Utility functions used in the plot
# Functions to plot ERA5 data before and after autoencoding
#  Takes data in tensorflow format (no geometry metadata, normalised)

import os
import sys
import math

# import iris
import numpy as np
#import tensorflow as tf
import matplotlib
import cmocean

sys.path.append(
    "%s/../../../data/prepare_training_tensors_ERA5_T2m/" % os.path.dirname(__file__)
)
from ERA5_load import ERA5_trim
from ERA5_load import ERA5_roll_longitude
from ERA5_load import ERA5_load_LS_mask

# It's a spatial map, so want the land mask
def get_land_mask():
    mask = ERA5_load_LS_mask()
    mask = ERA5_roll_longitude(mask)
    return ERA5_trim(mask)


def plot_T2m(
    ax,
    tmx,
    vMin=0,
    vMax=1,
    fog=None,
    fog_threshold=0.5,
    fog_steepness=10,
    obs=None,
    obs_c=None,
    o_size=1,
    land=None,
    label=None,
):


    if land is None:
        land = get_land_mask()
    lats = land.coord("latitude").points
    lons = land.coord("longitude").points
    land_img = ax.pcolorfast(
        lons, lats, land.data, cmap="Greys", alpha=0.1, vmax=1.1, vmin=-0.5, zorder=100
    )
    # Field data
    T_img = None
    if tmx is not None:
        T_img = ax.pcolormesh(
            lons,
            lats,
            tmx,
            shading="auto",
            cmap=cmocean.cm.balance, #"RdYlBu_r",
            vmin=vMin,
            vmax=vMax,
            alpha=1.0,
            zorder=40,
        )
        # Fog of ignorance
        nLevels = 10
        levels=np.concatenate(([0],np.linspace(0.33,1,num=nLevels)))
        if fog is not None:
            cs = ax.contourf(
                lons,
                lats,
                np.minimum(1.0, fog),
                levels,
                colors="none",
                vmin=0,
                vmax=1,
                hatches=[None]+["///"]*(nLevels-1),
                extend="upper",
                zorder=500,
            )
            nCols = len(cs.collections)
            alphas = np.linspace(0,1,num=nCols)
            for i, collection in enumerate(cs.collections):
                collection.set_edgecolor((0,0,0))
                collection.set_alpha(alphas[i])
                collection.set_facecolor('none')
                collection.set_linewidth(0.0)
            cs = ax.contourf(
                lons,
                lats,
                np.minimum(1.0, fog),
                levels,
                colors="none",
                vmin=0,
                vmax=1,
                hatches=[None]+["\\\\\\"]*(nLevels-1),
                extend="upper",
                zorder=500,
            )
            for i, collection in enumerate(cs.collections):
                collection.set_edgecolor((0,0,0))
                collection.set_alpha(alphas[i])
                collection.set_facecolor('none')
                collection.set_linewidth(0.0)

    # Observations
    if obs is not None:
        x = (obs[:, 1] / 1440) * 360 - 180
        y = (obs[:, 0] / 720) * 180 - 90
        y *= -1
        if obs_c is None:
            ax.scatter(
                ((x / 2).astype(int) + 1) * 2,
                ((y / 2).astype(int) + 1) * 2,
                s=3.0 * o_size,
                c='black',
                marker="o",
                alpha=0.8,
                zorder=600,
            )
        else:
            ax.scatter(
                ((x / 2).astype(int) + 1) * 2,
                ((y / 2).astype(int) + 1) * 2,
                s=3.0 * o_size,
                c=obs_c,
                cmap=cmocean.cm.balance, #"RdYlBu_r",
                vmin=vMin,
                vmax=vMax,
                marker="o",
                alpha=1.0,
                zorder=600,
            )

    if label is not None:
        ax.text(
            lons[0] + (lons[-1] - lons[0]) * 0.02,
            lats[0] + (lats[-1] - lats[0]) * 0.04,
            label,
            horizontalalignment="left",
            verticalalignment="top",
            color="black",
            bbox=dict(
                facecolor=(0.8, 0.8, 0.8, 0.8),
                edgecolor="black",
                boxstyle="round",
                pad=0.5,
            ),
            size=matplotlib.rcParams["font.size"] / 1.5,
            clip_on=True,
            zorder=100,
        )
    return T_img


def plot_scatter(ax, t_in, t_out, land=None, d_max=5, d_min=-5,
                 xlab='Original',ylab='Generated',lw=0.5):
    x = (t_in.flatten() - 0.5) * 10
    y = (t_out.flatten() - 0.5) * 10
    #    if land is not None:
    #        ld = land.data.flatten
    y = y[x != 0]
    x = x[x != 0]
    ax.hexbin(
        x=x,
        y=y,
        cmap=cmocean.cm.ice_r,
        bins="log",
        mincnt=1,
        extent=(d_min,d_max,d_min,d_max),
    )
    ax.add_line(
        matplotlib.lines.Line2D(
            xdata=(d_min, d_max),
            ydata=(d_min, d_max),
            linestyle="solid",
            linewidth=lw,
            color=(0.5, 0.5, 0.5, 1),
            zorder=100,
        )
    )
    ax.set(xlabel=xlab, ylabel=ylab)
    ax.grid(color="black", alpha=0.2, linestyle="-", linewidth=0.5)


def plot_colourbar(
    fig,
    ax,
    T_img,
):
    ax.set_axis_off()
    cb = fig.colorbar(
        T_img, ax=ax, location="bottom", orientation="horizontal", fraction=1.0
    )