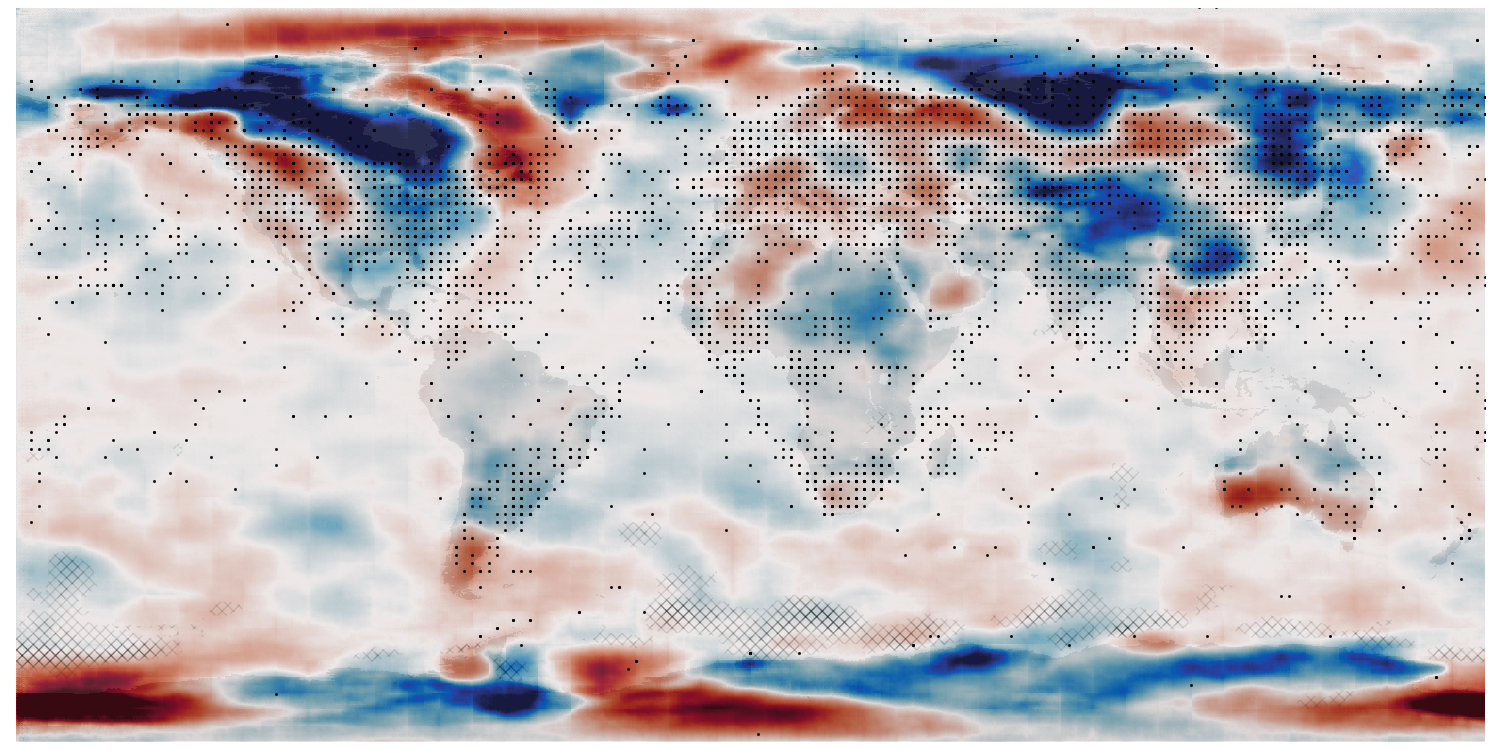
HadUK-Grid Tmax - DA by optimisation in latent space
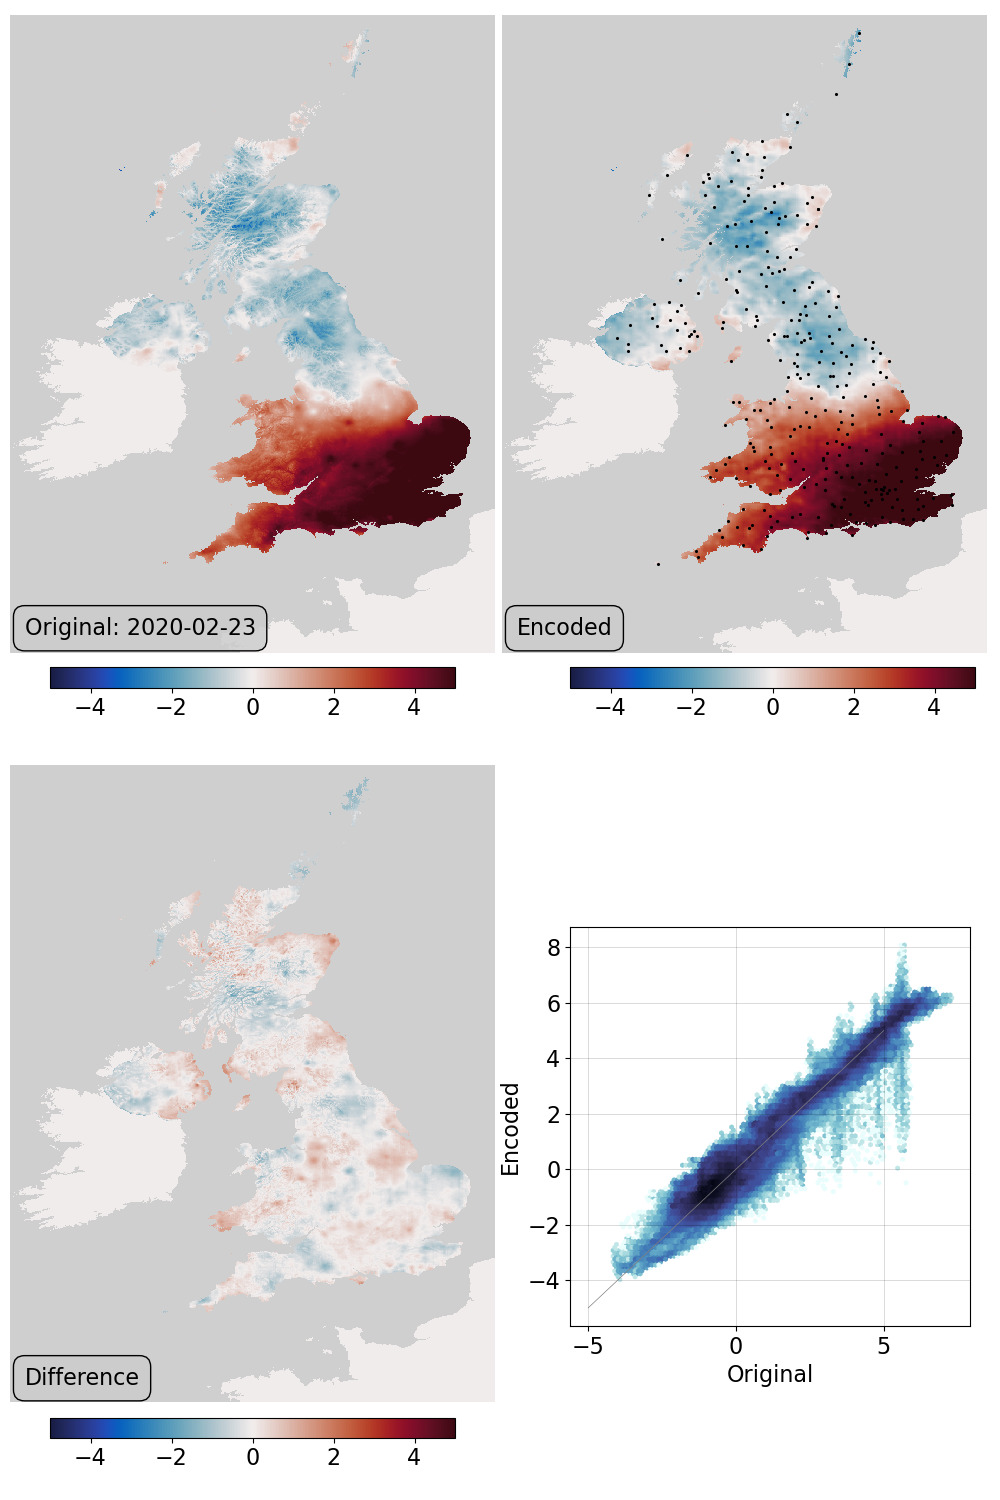
Assimilation validation: top left - original field, top right - generator output at the latent-space location that maximises fit to pseudo-observations at the station locations, bottom left - difference, bottom right - scatter original::output. This uses the locations of the 310 stations used in making the original field.
Script to find the optimal latent-space location and make the validation figure:
#!/usr/bin/env python

# Find a point in latent space that maximises the fit to a set of obs,
#  and plot the fitted state.

import os
import sys
import numpy as np

import tensorflow as tf
import tensorflow_probability as tfp
from tensorflow_addons.image import interpolate_bilinear

import random

import iris
import IRData.twcr as twcr
import datetime

import matplotlib
from matplotlib.backends.backend_agg import FigureCanvasAgg as FigureCanvas
from matplotlib.figure import Figure

import argparse

parser = argparse.ArgumentParser()
parser.add_argument("--epoch", help="Epoch", type=int, required=True)
parser.add_argument("--year", type=int, required=False, default=1979)
parser.add_argument("--month", type=int, required=False, default=3)
parser.add_argument("--day", type=int, required=False, default=12)
parser.add_argument("--obs_decimate", type=int, required=False, default=None)
parser.add_argument(
    "--osize", help="Obs. point size", type=float, required=False, default=0.5
)
args = parser.parse_args()

# Functions for plotting
sys.path.append("%s/../validation" % os.path.dirname(__file__))
from plot_HUKG_comparison import get_land_mask
from plot_HUKG_comparison import plot_Tmax
from plot_HUKG_comparison import plot_colourbar
from plot_HUKG_comparison import plot_scatter

# Make the input tensor for the specified date
sys.path.append(
    "%s/../../../data/prepare_training_tensors_HUKG_Tmax" % os.path.dirname(__file__)
)
from HUKG_load_tmax import HUKG_load_tmax
from HUKG_load_tmax import HUKG_load_tmax_climatology
from HUKG_load_tmax import HUKG_trim
from HUKG_load_tmax import HUKG_load_observations

t = HUKG_load_tmax(args.year, args.month, args.day)
c = HUKG_load_tmax_climatology(args.year, args.month, args.day)
t = t - c
t /= 10
t += 0.5
t = HUKG_trim(t)
t.data.data[t.data.mask] = 0.5
msk = t.data.mask
t_in = tf.convert_to_tensor(t.data.data, np.float32)
t_in = tf.reshape(t_in, [1, 1440, 896, 1])

# Get the observations
obs = HUKG_load_observations(args.year, args.month, args.day)
# Convert the obs locations to a tensor in the right units (0-1)
lat_min = t.coord("projection_y_coordinate").points[0]
lat_max = t.coord("projection_y_coordinate").points[-1]
t_lats = (obs["projection_y_coordinate"] - lat_min) / (lat_max - lat_min)
lon_min = t.coord("projection_x_coordinate").points[0]
lon_max = t.coord("projection_x_coordinate").points[-1]
t_lons = (obs["projection_x_coordinate"] - lon_min) / (lon_max - lon_min)
if args.obs_decimate is not None:
    t_lats = t_lats[::args.obs_decimate]
    t_lons = t_lons[::args.obs_decimate]
print("No of obs. = %d" % len(t_lons))
t_lats = tf.convert_to_tensor(t_lats, tf.float32)
t_lons = tf.convert_to_tensor(t_lons, tf.float32)
t_obs = tf.stack((t_lats * 1440, t_lons * 896), axis=1)
t_obs = tf.expand_dims(t_obs, 0)

# Set up the model and load the weights at the chosen epoch
sys.path.append("%s/.." % os.path.dirname(__file__))
from autoencoderModel import DCVAE

autoencoder = DCVAE()
weights_dir = ("%s/Proxy_20CR/models/DCVAE_single_HUKG_Tmax/" + "Epoch_%04d") % (
    os.getenv("SCRATCH"),
    args.epoch,
)
load_status = autoencoder.load_weights("%s/ckpt" % weights_dir).expect_partial()
# Check the load worked
load_status.assert_existing_objects_matched()

# We are using it in inference mode
# (I'm not at all sure this actually works)
autoencoder.decoder.trainable = False
for layer in autoencoder.decoder.layers:
    layer.trainable = False
autoencoder.decoder.compile()


latent = tf.Variable(tf.random.normal(shape=(1, autoencoder.latent_dim)))
target = tf.constant(t_in)

exact = tf.squeeze(interpolate_bilinear(target, t_obs, indexing="ij"))
# Filter out the nans (bad lat/lon)
t_obs = tf.boolean_mask(t_obs, ~tf.math.is_nan(exact), axis=1)
exact = tf.boolean_mask(exact, ~tf.math.is_nan(exact), axis=0)
approx = exact + tf.random.normal(
    shape=exact.shape, mean=0.0, stddev=0.0 / 10, dtype=tf.float32
)


def decodeFit():
    decoded = autoencoder.decode(latent)
    at_obs = tf.squeeze(interpolate_bilinear(decoded, t_obs, indexing="ij"))
    return tf.reduce_mean(tf.keras.metrics.mean_squared_error(approx, at_obs))


loss = tfp.math.minimize(
    decodeFit,
    trainable_variables=[latent],
    num_steps=1000,
    optimizer=tf.optimizers.Adam(learning_rate=0.05),
    convergence_criterion=tfp.optimizer.convergence_criteria.LossNotDecreasing(
        atol=0.00001, min_num_steps=100
    ),
)
#print(loss)

encoded = autoencoder.decode(latent)

# Make the figure
lm = get_land_mask()

fig = Figure(
    figsize=(10, 15),
    dpi=100,
    facecolor=(0.88, 0.88, 0.88, 1),
    edgecolor=None,
    linewidth=0.0,
    frameon=False,
    subplotpars=None,
    tight_layout=None,
)
canvas = FigureCanvas(fig)
matplotlib.rcParams.update({"font.size": 16})

ax_global = fig.add_axes([0, 0, 1, 1], facecolor="white")
ax_global.set_axis_off()
ax_global.autoscale(enable=False)
ax_global.fill((-0.1, 1.1, 1.1, -0.1), (-0.1, -0.1, 1.1, 1.1), "white")

# Top left - original field
ax_of = fig.add_axes([0.01, 0.565, 0.485, 0.425])
ax_of.set_aspect("auto")
ax_of.set_axis_off()
ofp = plot_Tmax(
    ax_of,
    (t_in - 0.5) * 10,
    vMin=-5,
    vMax=5,
    land=lm,
    label="Original: %04d-%02d-%02d" % (args.year, args.month, args.day),
)
ax_ocb = fig.add_axes([0.05, 0.505, 0.405, 0.05])
plot_colourbar(fig, ax_ocb, ofp)

# Top right - encoded field
ax_of = fig.add_axes([0.502, 0.565, 0.485, 0.425])
ax_of.set_aspect("auto")
ax_of.set_axis_off()
ofp = plot_Tmax(
    ax_of,
    (encoded - 0.5) * 10,
    vMin=-5,
    vMax=5,
    obs=t_obs,
    o_size=args.osize,
    land=lm,
    mask=msk,
    label="Encoded",
)
ax_ocb = fig.add_axes([0.57, 0.505, 0.405, 0.05])
plot_colourbar(fig, ax_ocb, ofp)

# Bottom left - difference field
ax_of = fig.add_axes([0.01, 0.065, 0.485, 0.425])
ax_of.set_aspect("auto")
ax_of.set_axis_off()
ofp = plot_Tmax(
    ax_of,
    (encoded - t_in) * 10,
    vMin=-5,
    vMax=5,
    land=lm,
    mask=msk,
    label="Difference",
)
ax_ocb = fig.add_axes([0.05, 0.005, 0.405, 0.05])
plot_colourbar(fig, ax_ocb, ofp)

# Bottom right - scatterplot

ax_scatter = fig.add_axes([0.57, 0.116, 0.4, 0.266])
plot_scatter(ax_scatter, t_in, encoded)

fig.savefig("fit.png")