Mean-sea-level pressure - validate the trained VAE
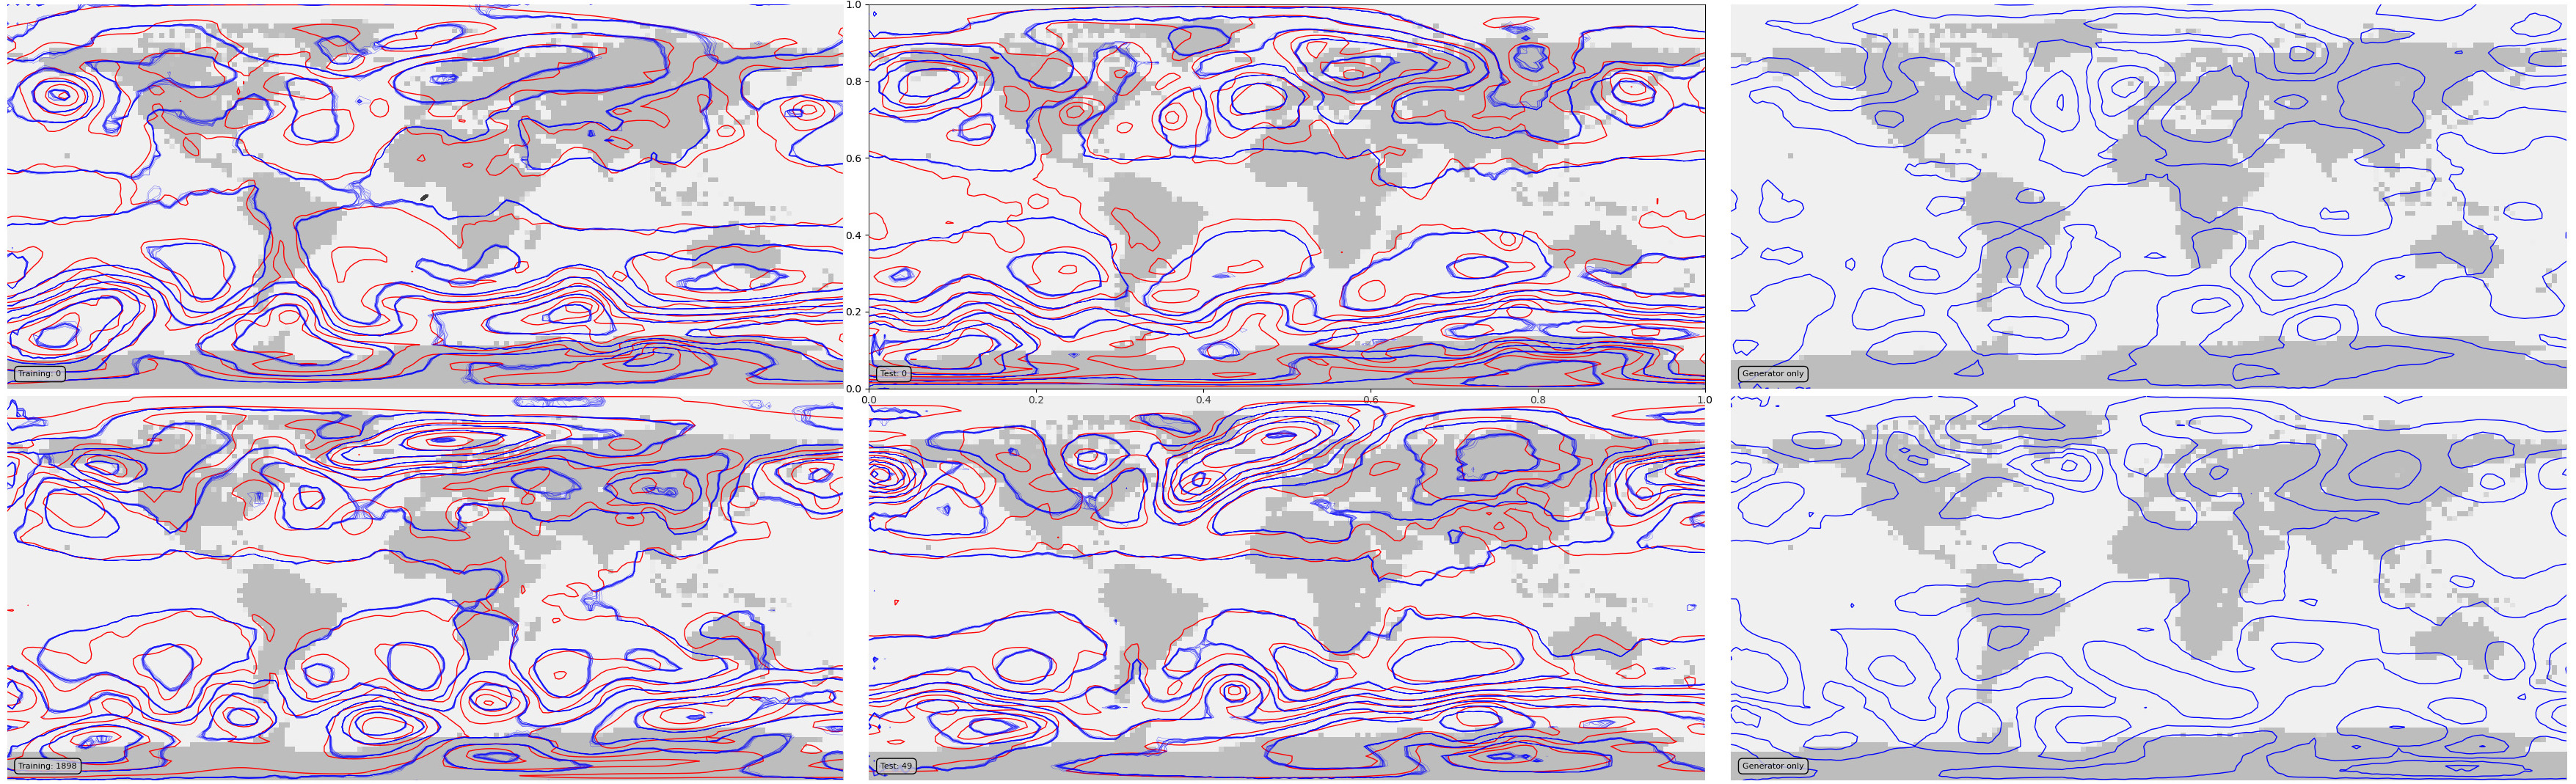
VAE validation: Red contours are from the input dataset, blue contours show generator output. The two left hand plots show comparisons of two cases from the training dataset, the middle plots two cases from the test dataset, and the right hand plots two examples of generator output.
Script to make the validation figure
#!/usr/bin/env python

# Plot a validation figure for the autoencoder.

# Three groups of tests:
#  1) Samples from the training dataset
#  2) Samples from the test dataset
#  3) Generated samples from random points in the latent space
#
# In each case, half the points are fixed (the same each time this is run),
#  and half are random samples (different each time).

import tensorflow as tf
import os
import sys
import random

import matplotlib
from matplotlib.backends.backend_agg import FigureCanvasAgg as FigureCanvas
from matplotlib.figure import Figure

import argparse

parser = argparse.ArgumentParser()
parser.add_argument("--epoch", help="Epoch", type=int, required=True)
args = parser.parse_args()

sys.path.append("%s/." % os.path.dirname(__file__))
from plot_prmsl_comparison import get_land_mask
from plot_prmsl_comparison import plot_PRMSL
from plot_prmsl_comparison import plot_scatter

# Load the data source provider
sys.path.append("%s/../../PRMSL_dataset" % os.path.dirname(__file__))
from makeDataset import getDataset

trainingData = getDataset(purpose="training")
testData = getDataset(purpose="test")

# Set up the model and load the weights at the chosen epoch
sys.path.append("%s/.." % os.path.dirname(__file__))
from autoencoderModel import DCVAE

autoencoder = DCVAE()
weights_dir = ("%s/Proxy_20CR/models/DCVAE_single_PRMSL/" + "Epoch_%04d") % (
    os.getenv("SCRATCH"),
    args.epoch,
)
load_status = autoencoder.load_weights("%s/ckpt" % weights_dir)
# Check the load worked
load_status.assert_existing_objects_matched()


fig = Figure(
    figsize=(35.6, 10.8),
    dpi=100,
    facecolor=(0.88, 0.88, 0.88, 1),
    edgecolor=None,
    linewidth=0.0,
    frameon=False,
    subplotpars=None,
    tight_layout=None,
)
canvas = FigureCanvas(fig)

ax_global = fig.add_axes([0, 0, 1, 1], facecolor="white")
lm = get_land_mask()

# Plot two examples from the training data set: First, and one at random
count = 0
rnd = random.randint(1, 2567)
for t_in in trainingData:
    if count == 0:
        encoded = autoencoder.sample_call(tf.reshape(t_in, [1, 80, 160, 1]), size=15)
        ax_plot = fig.add_axes([0.01, 0.505, 0.32, 0.485])
        ax_plot.set_aspect("auto")
        ax_plot.set_axis_off()
        plot_PRMSL(
            ax_plot,
            t_in,
            encoded,
            land=lm,
            label="Training: %d" % count,
            linewidths=[1,0.2],
        )
        ax_scatter = fig.add_axes([0.34, 0.505, 0.32, 0.485])
        ax_plot.set_aspect("auto")
        plot_scatter(ax_plot,t_in,encoded)
    if count == rnd:
        encoded = autoencoder.sample_call(tf.reshape(t_in, [1, 80, 160, 1]), size=15)
        ax_plot = fig.add_axes([0.01, 0.01, 0.32, 0.485])
        ax_plot.set_aspect("auto")
        ax_plot.set_axis_off()
        plot_PRMSL(
            ax_plot,
            t_in,
            encoded,
            land=lm,
            label="Training: %d" % count,
            linewidths=[1,0.2],
        )
        break
    count += 1

# Plot two examples from the test data set: First, and one at random
count = 0
rnd = random.randint(1, 284)
for t_in in testData:
    if count == 0:
        encoded = autoencoder.sample_call(tf.reshape(t_in, [1, 80, 160, 1]), size=15)
        ax_plot = fig.add_axes([0.34, 0.505, 0.32, 0.485])
        ax_plot.set_aspect("auto")
        ax_plot.set_axis_off()
        plot_PRMSL(
            ax_plot,
            t_in,
            encoded,
            land=lm,
            label="Test: %d" % count,
            linewidths=[1,0.2],
        )
    if count == rnd:
        encoded = autoencoder.sample_call(tf.reshape(t_in, [1, 80, 160, 1]), size=15)
        ax_plot = fig.add_axes([0.34, 0.01, 0.32, 0.485])
        ax_plot.set_aspect("auto")
        ax_plot.set_axis_off()
        plot_PRMSL(
            ax_plot,
            t_in,
            encoded,
            land=lm,
            label="Test: %d" % count,
            linewidths=[1,0.2],
        )
        break
    count += 1

# Plot two examples of generated fields
for y in [0.505, 0.01]:
    eps = tf.random.normal(shape=(1, autoencoder.latent_dim))
    generated = autoencoder.decode(eps)
    ax_plot = fig.add_axes([0.67, y, 0.32, 0.485])
    ax_plot.set_aspect("auto")
    ax_plot.set_axis_off()
    plot_PRMSL(
        ax_plot,
        None,
        tf.reshape(generated, [80, 160]),
        land=lm,
        label="Generator only",
    )

fig.savefig("comparison.png")
Utility functions used in the plot
# Functions to plot PRMSL before and after autoencoding
#  Takes data in tensorflow format (no geometry metadata, normalised)

import os
import sys
import iris
import numpy as np
import tensorflow as tf

sys.path.append("%s/../../../lib/" % os.path.dirname(__file__))
from geometry import to_analysis_grid

# It's a spatial map, so want the land mask
def get_land_mask():
    mask = iris.load_cube(
        "%s/fixed_fields/land_mask/opfc_global_2019.nc" % os.getenv("DATADIR")
    )
    return to_analysis_grid(mask)


def plot_PRMSL(ax, t_in, t_out, obs=None, obs_c = 'black', obs_cmap='RdBu',land=None, label=None,linewidths=[1,1,1]):
    if land is None:
        land = get_land_mask()
    lats = land.coord("latitude").points
    lons = land.coord("longitude").points
    land_img = ax.pcolorfast(
        lons, lats, land.data, cmap="Greys", alpha=0.3, vmax=1.2, vmin=-0.5, zorder=10
    )
    # 20CR2c data
    if t_in is not None:
        t_in = tf.squeeze(t_in)
        if tf.rank(t_in)==2:
            t_in = tf.expand_dims(t_in,axis=0)
        t_list = tf.unstack(t_in,axis=0)
        for t_in in t_list:
            CS = ax.contour(
                lons,
                lats,
                t_in.numpy(),
                colors="red",
                linewidths=linewidths[0],
                linestyles='solid',
                alpha=1.0,
                levels=np.arange(-3, 3, 0.3),
                zorder=20,
            )
    # Encoder output
    if t_out is not None:
        t_out = tf.squeeze(t_out)
        if tf.rank(t_out)==2:
            t_out = tf.expand_dims(t_out,axis=0)
        t_list = tf.unstack(t_out,axis=0)
        for t_out in t_list:
            CS = ax.contour(
                lons,
                lats,
                t_out.numpy(),
                colors="blue",
                linewidths=linewidths[1],
                linestyles='solid',
                alpha=1.0,
                levels=np.arange(-3, 3, 0.3),
                zorder=30,
            )
   # Observations
    if obs is not None:
        obs = tf.squeeze(obs)
        ax.scatter((obs[:,1].numpy()/160)*360-180,
                (obs[:,0].numpy()/80)*180-90,
                s=3.0*linewidths[2],
                c=obs_c,
                cmap=obs_cmap,
                marker='o',
                alpha=1.0,
                zorder=10)
    ax.text(
        -175,
        -85,
        label,
        horizontalalignment="left",
        verticalalignment="bottom",
        color="black",
        bbox=dict(
            facecolor=(0.8, 0.8, 0.8, 0.8), edgecolor="black", boxstyle="round", pad=0.5
        ),
        size=8,
        clip_on=True,
        zorder=40,
    )

def plot_scatter(ax,t_in,t_out,d_max=3,d_min=-3):
    t_in = tf.squeeze(t_in)
    if tf.rank(t_in)!=2:
        raise Exception("Unsupported input data shape")
    t_out = tf.squeeze(t_out)
    if tf.rank(t_out)==2:
        t_out = tf.expand_dims(t_out,axis=0)
    t_list = tf.unstack(t_out,axis=0)
    for t_out in t_list:
        ax.scatter(x=t_in.numpy().flatten(),
                   y=t_out.numpy().flatten(),
                   c='black',
                   alpha=0.25,
                   marker='.',
                   s=2)
    ax.set(ylabel='Original',
           xlabel='Encoded')
    ax.grid(color='black',
            alpha=0.2,
            linestyle='-',
            linewidth=0.5)