Pressure from wind - validate the trained VAE
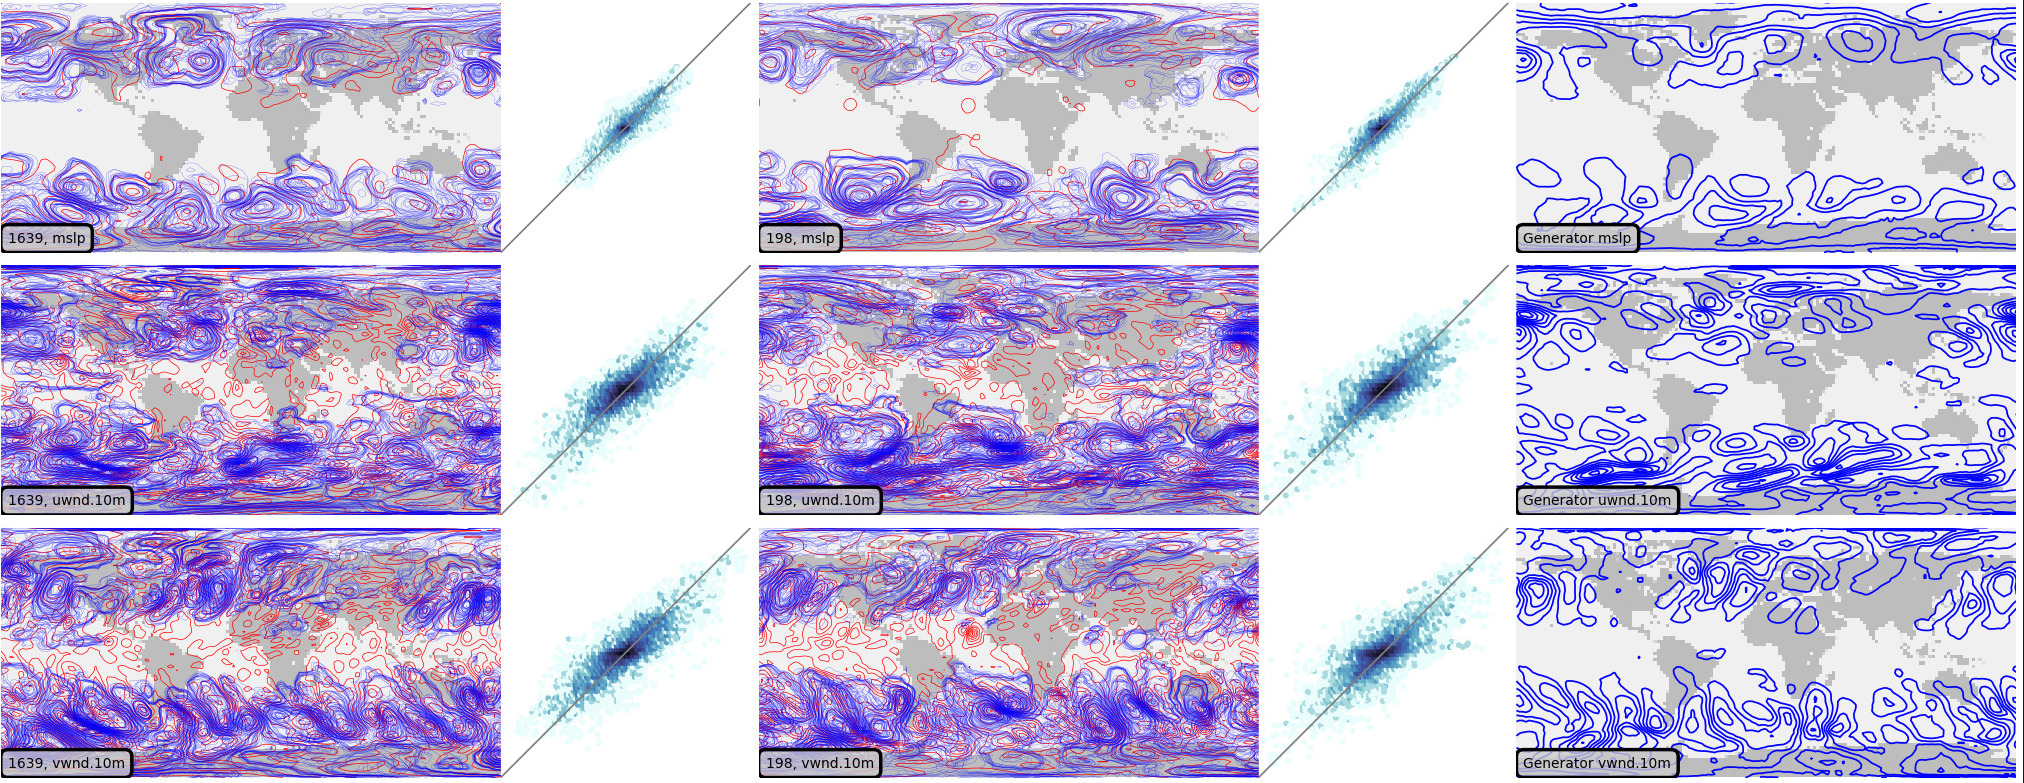
VAE validation: Red contours are from the input dataset, blue contours show generator output. The three rows are the variables: mslp - top, u10m - middle, v10m - bottom. The left hand column shows comparisons of a case from the training dataset, the middle column a case from the test dataset, and the right hand column an example of generator output.
Script to make the validation figure
#!/usr/bin/env python

# Plot a validation figure for the autoencoder.

# Three tests:
#  1) Sample from the training dataset
#  2) Sample from the test dataset
#  3) Generated samples from random point in the latent space
#

import tensorflow as tf
import os
import sys
import random

import matplotlib
from matplotlib.backends.backend_agg import FigureCanvasAgg as FigureCanvas
from matplotlib.figure import Figure

import argparse

parser = argparse.ArgumentParser()
parser.add_argument("--epoch", help="Epoch", type=int, required=False, default=25)
args = parser.parse_args()

sys.path.append("%s/." % os.path.dirname(__file__))
from plot_prmsl_comparison import get_land_mask
from plot_prmsl_comparison import plot_PRMSL
from plot_prmsl_comparison import plot_scatter

# Load the data source provider
sys.path.append("%s/../../PUV_dataset" % os.path.dirname(__file__))
from makeDataset import getDataset

trainingData = getDataset(purpose="training")
testData = getDataset(purpose="test")

# Set up the model and load the weights at the chosen epoch
sys.path.append("%s/.." % os.path.dirname(__file__))
from autoencoderModel import DCVAE

autoencoder = DCVAE()
weights_dir = ("%s/Proxy_20CR/models/DCVAE_single_PUV/" + "Epoch_%04d") % (
    os.getenv("SCRATCH"),
    args.epoch,
)
load_status = autoencoder.load_weights("%s/ckpt" % weights_dir)
# Check the load worked
load_status.assert_existing_objects_matched()

margin = 0.05
f_width = (margin * 5 / 8) * 4 + 3 + 3 + 2
f_height = margin * 4 + 3
s_width = 1 / f_width
s_height = 1 / f_height
m_width = (margin * 5 / 8) / f_width
m_height = margin / f_height
fig = Figure(
    figsize=(f_width, f_height),
    dpi=250,
    facecolor=(0.88, 0.88, 0.88, 1),
    edgecolor=None,
    linewidth=0.0,
    frameon=False,
    subplotpars=None,
    tight_layout=None,
)
canvas = FigureCanvas(fig)

ax_global = fig.add_axes([0, 0, 1, 1], facecolor="white")
lm = get_land_mask()

# Plot a random example from the training dataset
count = 0
rnd = random.randint(1, 2567)
for t_in in trainingData:
    if count == rnd:
        encoded = autoencoder.sample_call(tf.reshape(t_in, [1, 80, 160, 3]), size=15)
        for tp in range(3):  # Each variable
            ax_plot = fig.add_axes(
                [m_width, 1 - (m_height + s_height) * (tp + 1), 2 * s_width, s_height]
            )
            ax_plot.set_aspect("auto")
            ax_plot.set_axis_off()
            plot_PRMSL(
                ax_plot,
                t_in[:, :, tp],
                encoded[:, :, :, :, tp],
                land=lm,
                label="%d, %s" % (count, ("mslp","uwnd.10m","vwnd.10m")[tp]),
                linewidths=[0.2, 0.05],
                d_min=-0.25,
                d_max=1.25,
                c_space=0.1,
            )
            ax_scatter = fig.add_axes(
                [
                    m_width + 2 * s_width,
                    1 - (m_height + s_height) * (tp + 1),
                    s_width,
                    s_height,
                ]
            )
            ax_scatter.set_aspect("auto")
            ax_scatter.set_axis_off()
            plot_scatter(
                ax_scatter,
                t_in[:, :, tp],
                encoded[:, :, :, :, tp],
                d_min=-0.25,
                d_max=1.25,
            )
        break
    count += 1

# Plot one random example from the test data set:
count = 0
rnd = random.randint(1, 256)
for t_in in testData:
    if count == rnd:
        encoded = autoencoder.sample_call(tf.reshape(t_in, [1, 80, 160, 3]), size=15)
        for tp in range(3):  # Each variable
            ax_plot = fig.add_axes(
                [
                    m_width * 2 + 3 * s_width,
                    1 - (m_height + s_height) * (tp + 1),
                    2 * s_width,
                    s_height,
                ]
            )
            ax_plot.set_aspect("auto")
            ax_plot.set_axis_off()
            plot_PRMSL(
                ax_plot,
                t_in[:, :, tp],
                encoded[:, :, :, :, tp],
                land=lm,
                label="%d, %s" % (count, ("mslp","uwnd.10m","vwnd.10m")[tp]),
                linewidths=[0.2, 0.05],
                d_min=-0.25,
                d_max=1.25,
                c_space=0.1,
            )
            ax_scatter = fig.add_axes(
                [
                    m_width * 2 + 5 * s_width,
                    1 - (m_height + s_height) * (tp + 1),
                    s_width,
                    s_height,
                ]
            )
            ax_scatter.set_axis_off()
            plot_scatter(
                ax_scatter,
                t_in[:, :, tp],
                encoded[:, :, :, :, tp],
                d_min=-0.25,
                d_max=1.25,
            )
        break
    count += 1

# Plot one example of a generated field
eps = tf.random.normal(shape=(1, autoencoder.latent_dim))
generated = autoencoder.decode(eps)
for tp in range(3):  # Each time-slice
    ax_plot = fig.add_axes(
        [
            m_width * 3 + 6 * s_width,
            1 - (m_height + s_height) * (tp + 1),
            2 * s_width,
            s_height,
        ]
    )
    ax_plot.set_aspect("auto")
    ax_plot.set_axis_off()
    plot_PRMSL(
        ax_plot,
        None,
        generated[:, :, :, tp],
        land=lm,
        label="Generator %s" % ("mslp","uwnd.10m","vwnd.10m")[tp],
        linewidths=[0.5, 0.5],
        d_min=-0.25,
        d_max=1.25,
        c_space=0.1,
    )

fig.savefig("comparison.png")
Utility functions used in the plot
# Functions to plot PRMSL before and after autoencoding
#  Takes data in tensorflow format (no geometry metadata, normalised)

import os
import sys
import iris
import numpy as np
import tensorflow as tf
import matplotlib
import cmocean

sys.path.append("%s/../../../lib/" % os.path.dirname(__file__))
from geometry import to_analysis_grid

# It's a spatial map, so want the land mask
def get_land_mask():
    mask = iris.load_cube(
        "%s/fixed_fields/land_mask/opfc_global_2019.nc" % os.getenv("DATADIR")
    )
    return to_analysis_grid(mask)


def plot_PRMSL(
    ax,
    t_in,
    t_out,
    obs=None,
    obs_c="black",
    obs_cmap="RdBu",
    land=None,
    label=None,
    d_max=1,
    d_min=0,
    c_space=0.3,
    linewidths=[1, 1, 1],
):
    if land is None:
        land = get_land_mask()
    lats = land.coord("latitude").points
    lons = land.coord("longitude").points
    land_img = ax.pcolorfast(
        lons, lats, land.data, cmap="Greys", alpha=0.3, vmax=1.2, vmin=-0.5, zorder=10
    )
    # 20CR2c data
    if t_in is not None:
        t_in = tf.squeeze(t_in)
        if tf.rank(t_in) == 2:
            t_in = tf.expand_dims(t_in, axis=0)
        t_list = tf.unstack(t_in, axis=0)
        for t_in in t_list:
            CS = ax.contour(
                lons,
                lats,
                t_in.numpy(),
                colors="red",
                linewidths=linewidths[0],
                linestyles="solid",
                alpha=1.0,
                levels=np.arange(d_min, d_max, c_space),
                zorder=20,
            )
    # Encoder output
    if t_out is not None:
        t_out = tf.squeeze(t_out)
        if tf.rank(t_out) == 2:
            t_out = tf.expand_dims(t_out, axis=0)
        t_list = tf.unstack(t_out, axis=0)
        for t_out in t_list:
            CS = ax.contour(
                lons,
                lats,
                t_out.numpy(),
                colors="blue",
                linewidths=linewidths[1],
                linestyles="solid",
                alpha=1.0,
                levels=np.arange(d_min, d_max, c_space),
                zorder=30,
            )
    # Observations
    if obs is not None:
        obs = tf.squeeze(obs)
        ax.scatter(
            (obs[:, 1].numpy() / 160) * 360 - 180,
            (obs[:, 0].numpy() / 80) * 180 - 90,
            s=3.0 * linewidths[2],
            c=obs_c,
            cmap=obs_cmap,
            marker="o",
            alpha=1.0,
            zorder=10,
        )
    ax.text(
        -175,
        -85,
        label,
        horizontalalignment="left",
        verticalalignment="bottom",
        color="black",
        bbox=dict(
            facecolor=(0.8, 0.8, 0.8, 0.8), edgecolor="black", boxstyle="round", pad=0.5
        ),
        size=4,
        clip_on=True,
        zorder=40,
    )


def plot_scatter(ax, t_in, t_out, d_max=3, d_min=-3):
    ax.set_xlim(d_min, d_max)
    ax.set_ylim(d_min, d_max)
    t_in = tf.squeeze(t_in)
    if tf.rank(t_in) != 2:
        raise Exception("Unsupported input data shape")
    t_out = tf.squeeze(t_out)
    if tf.rank(t_out) == 2:
        t_out = tf.expand_dims(t_out, axis=0)
    t_list = tf.unstack(t_out, axis=0)
    hb_in = None
    hb_out = None
    for t_out in t_list:
        if hb_in is None:
            hb_in = t_in.numpy().flatten()
            hb_out = t_out.numpy().flatten()
        else:
            hb_in = np.concatenate((hb_in, t_in.numpy().flatten()))
            hb_out = np.concatenate((hb_out, t_out.numpy().flatten()))
    ax.hexbin(
        x=t_in.numpy().flatten(),
        y=t_out.numpy().flatten(),
        cmap=cmocean.cm.ice_r,
        bins="log",
        mincnt=1,
    )
    ax.add_line(
        matplotlib.lines.Line2D(
            xdata=(d_min, d_max),
            ydata=(d_min, d_max),
            linestyle="solid",
            linewidth=0.5,
            color=(0.5, 0.5, 0.5, 1),
            zorder=100,
        )
    )
    ax.set(ylabel="Original", xlabel="Encoded")
    ax.grid(color="black", alpha=0.2, linestyle="-", linewidth=0.5)