Tuned convolutional transcriber: training summary
See also
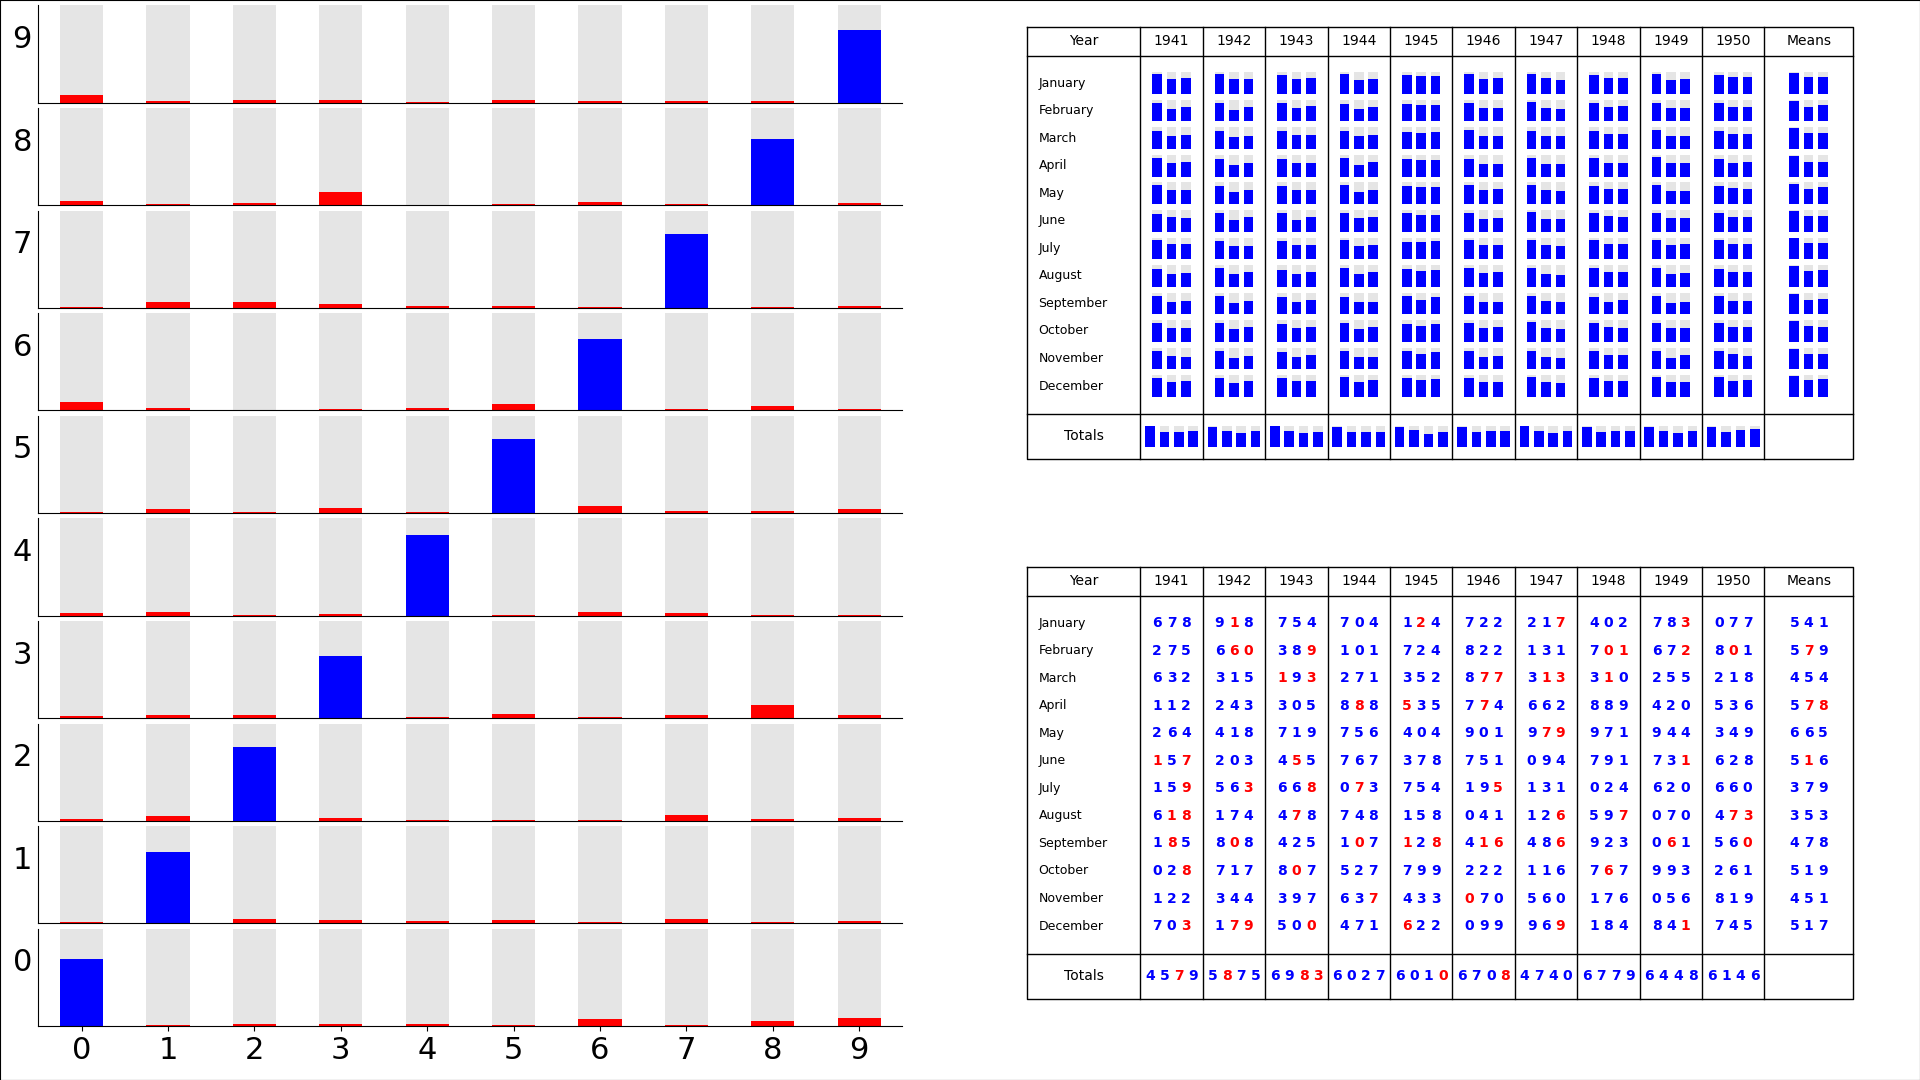
Validation summary after 10 epochs.
On the left, Probability distribution of digits from the test dataset, as transcribed by the model, partitioned by correct answer (vertical axis) and transcribed value (horizontal axis). That is, the bottom left are digits that are really ‘0’ and are transcribed as ‘0’, bottom right - digits that are really ‘0’ but are transcribed as ‘9’, top left - digits that are really ‘9’ but are transcribed as ‘0’, …
Top right - Mean probability of correctness for digits from the test dataset, partitioned by location in the image.
Bottom right - the most-likely digit in each location for a single test case . Digits in blue are correct, in red mistakes.
Code to make the figure
#!/usr/bin/env python

# Make a single frame of the training progress video

import os
import sys

import tensorflow as tf
import numpy
import itertools

import matplotlib
from matplotlib.backends.backend_agg import FigureCanvasAgg as FigureCanvas
from matplotlib.figure import Figure
from matplotlib.patches import Rectangle
from matplotlib.lines import Line2D

sys.path.append("%s/../" % os.path.dirname(__file__))
from transcriberModel import transcriberModel

sys.path.append("%s/../../dataset" % os.path.dirname(__file__))
from makeDataset import getImageDataset
from makeDataset import getNumbersDataset

import argparse

parser = argparse.ArgumentParser()
parser.add_argument("--epoch", help="Epoch", type=float, required=True)
# Set nimages to a small number for fast testing
parser.add_argument(
    "--nimages",
    help="No of test cases to look at",
    type=int,
    required=False,
    default=None,
)
args = parser.parse_args()

# Set pu the figure
fig = Figure(
    figsize=(19.20, 10.80),
    dpi=100,
    facecolor="white",
    edgecolor="black",
    linewidth=0.0,
    frameon=False,
    subplotpars=None,
    tight_layout=None,
)
matplotlib.rcParams.update({"font.size": 22})
canvas = FigureCanvas(fig)
# Paint the background white - why is this needed?
ax_full = fig.add_axes([0, 0, 1, 1])
ax_full.set_xlim([0, 1])
ax_full.set_ylim([0, 1])
ax_full.add_patch(
    matplotlib.patches.Rectangle((0, 0), 1, 1, fill=True, facecolor="white")
)


# Set up the model and load the weights at the chosen epoch
transcriber1 = transcriberModel()
weights_dir = ("%s/ML_ATB2/models/tuned_convolutional_transcriber/" + "Epoch_%04d") % (
    os.getenv("SCRATCH"),
    int(args.epoch) - 1,
)
if args.epoch >= 1:
    load_status = transcriber1.load_weights("%s/ckpt" % weights_dir)
    load_status.assert_existing_objects_matched()

transcriber2 = transcriberModel()
weights_dir = ("%s/ML_ATB2/models/tuned_convolutional_transcriber/" + "Epoch_%04d") % (
    os.getenv("SCRATCH"),
    int(args.epoch),
)
if args.epoch < 50:
    load_status = transcriber2.load_weights("%s/ckpt" % weights_dir)
    load_status.assert_existing_objects_matched()

# Make the probability matrix
testImages = getImageDataset(purpose="test", nImages=args.nimages)
testNumbers = getNumbersDataset(purpose="test", nImages=args.nimages)
testData = tf.data.Dataset.zip((testImages, testNumbers))
# Need the size of the dataset
if args.nimages is None:
    nimages = sum(1 for _ in testData)
else:
    nimages = args.nimages

count = numpy.zeros(10)
pmatrix = numpy.zeros((10, 10))
dcount = 0
plmatrix = numpy.zeros((436))
origN = None
encN = None
for testCase in testData:
    image = testCase[0]
    orig = testCase[1]
    if args.epoch==50 or dcount/nimages <= args.epoch%1:
        encoded = transcriber1(tf.reshape(image, [1, 1024, 768, 3]), training=False)
    else:
        encoded = transcriber2(tf.reshape(image, [1, 1024, 768, 3]), training=False)
    # Save the first case for ploting
    if origN is None:
        origN = orig
        encN = encoded
    # PvP matrix
    for tidx in range(orig.shape[0]):
        originalDigit = numpy.where(orig[tidx, :] == 1.0)[0]
        dgProbabilities = encoded[0, tidx, :]
        pmatrix[originalDigit, :] += dgProbabilities
        count[originalDigit] += 1
    # Place matrix
    for tidx in range(436):
        originalDigit = numpy.where(orig[tidx, :] == 1.0)[0][0]
        dgProbabilities = encoded[0, tidx, originalDigit]
        plmatrix[tidx] += dgProbabilities

pmatrix /= count
plmatrix /= nimages


# Plot the probability matrix

# Plot a bar chart of transcription probabilities for a single digit
def plot1(ax, d):
    for td in range(10):
        fc = "red"
        if td == d:
            fc = "blue"
        ax.add_patch(
            matplotlib.patches.Rectangle(
                (td - 0.25, 0), 0.5, 1, fill=True, facecolor=(0, 0, 0, 0.1)
            )
        )
        ax.add_patch(
            matplotlib.patches.Rectangle(
                (td - 0.25, 0), 0.5, pmatrix[d, td], fill=True, facecolor=fc
            )
        )

for td in range(10):
    ax_digit = fig.add_axes([0.02, 0.05 + (td * 0.1) * 0.95, 0.45, 0.09])
    ax_digit.set_xlim([-0.5, 9.5])
    ax_digit.set_ylim([0, 1])
    ax_digit.spines["top"].set_visible(False)
    ax_digit.spines["right"].set_visible(False)
    if td != 0:
        ax_digit.get_xaxis().set_ticks([])
    else:
        ax_digit.get_xaxis().set_ticks(range(10))
        # ax_digit.set_xlabel("Transcribed choice")
    ax_digit.get_yaxis().set_ticks([])
    ax_digit.set_ylabel("%1d  " % td, rotation=0)
    plot1(ax_digit, td)

# plot the place distribution
ax_full = fig.add_axes([0.5, 0.25, 0.5, 1])
ax_full.set_xlim([0, 1])
ax_full.set_ylim([0, 1])
ax_full.set_axis_off()
imp = {
    "scale": 1.0,
    "xscale": 1.0,
    "yscale": 1.0,
    "xshift": 0.0,  # pixels, +ve right
    "yshift": 0.0,  # pixels, +ve up
    "rotate": 0.0,  # degrees clockwise
    "linewidth": 1.0,
    "bgcolour": (1.0, 1.0, 1.0),
    "fgcolour": (0.0, 0.0, 0.0),
    "yearHeight": 0.066,  # Fractional height of year row
    "totalsHeight": 0.105,  # Fractional height of totals row
    "monthsWidth": 0.137,  # Fractional width of months row
    "meansWidth": 0.107,  # Fractional width of means row
    "fontSize": 10,
    "year": 1941,
}

# Box with the data in
topLeft = (0.07 + imp["xshift"] / 768, 0.725 + imp["yshift"] / 1024)
topRight = (
    0.93 + imp["xshift"] / 768 + (imp["xscale"] - 1) * 0.86,
    0.725 + imp["yshift"] / 1024,
)
bottomLeft = (0.07 + imp["xshift"] / 768, 0.325 + imp["yshift"] / 1024)
bottomRight = (
    0.93 + imp["xshift"] / 768 + (imp["xscale"] - 1) * 0.86,
    0.325 + imp["yshift"] / 1024 - (imp["yscale"] - 1) * 0.4,
)
ax_full.add_line(
    Line2D(
        xdata=(topLeft[0], topRight[0], bottomRight[0], bottomLeft[0], topLeft[0]),
        ydata=(topLeft[1], topRight[1], bottomRight[1], bottomLeft[1], topLeft[1]),
        linestyle="solid",
        linewidth=imp["linewidth"],
        color=imp["fgcolour"],
        zorder=1,
    )
)


def topAt(x):  # x is fraction along top line
    return (
        topRight[0] * x + topLeft[0] * (1 - x),
        topRight[1] * x + topLeft[1] * (1 - x),
    )


def bottomAt(x):
    return (
        bottomRight[0] * x + bottomLeft[0] * (1 - x),
        bottomRight[1] * x + bottomLeft[1] * (1 - x),
    )


def leftAt(y):  # y is fraction of way from bottom to top
    return (
        topLeft[0] * y + bottomLeft[0] * (1 - y),
        topLeft[1] * y + bottomLeft[1] * (1 - y),
    )


def rightAt(y):
    return (
        topRight[0] * y + bottomRight[0] * (1 - y),
        topRight[1] * y + bottomRight[1] * (1 - y),
    )


# Draw the grid
lft = leftAt(1.0 - imp["yearHeight"])
rgt = rightAt(1.0 - imp["yearHeight"])
ax_full.add_line(
    Line2D(
        xdata=(lft[0], rgt[0]),
        ydata=(lft[1], rgt[1]),
        linestyle="solid",
        linewidth=imp["linewidth"],
        color=imp["fgcolour"],
        zorder=1,
    )
)
lft = leftAt(imp["totalsHeight"])
rgt = rightAt(imp["totalsHeight"])
ax_full.add_line(
    Line2D(
        xdata=(lft[0], rgt[0]),
        ydata=(lft[1], rgt[1]),
        linestyle="solid",
        linewidth=imp["linewidth"],
        color=imp["fgcolour"],
        zorder=1,
    )
)
tp = topAt(imp["monthsWidth"])
bm = bottomAt(imp["monthsWidth"])
ax_full.add_line(
    Line2D(
        xdata=(tp[0], bm[0]),
        ydata=(tp[1], bm[1]),
        linestyle="solid",
        linewidth=imp["linewidth"],
        color=imp["fgcolour"],
        zorder=1,
    )
)
tp = topAt(1.0 - imp["meansWidth"])
bm = bottomAt(1.0 - imp["meansWidth"])
ax_full.add_line(
    Line2D(
        xdata=(tp[0], bm[0]),
        ydata=(tp[1], bm[1]),
        linestyle="solid",
        linewidth=imp["linewidth"],
        color=imp["fgcolour"],
        zorder=1,
    )
)
for yrl in range(1, 10):
    x = imp["monthsWidth"] + yrl * (1.0 - imp["meansWidth"] - imp["monthsWidth"]) / 10
    tp = topAt(x)
    bm = bottomAt(x)
    ax_full.add_line(
        Line2D(
            xdata=(tp[0], bm[0]),
            ydata=(tp[1], bm[1]),
            linestyle="solid",
            linewidth=imp["linewidth"],
            color=imp["fgcolour"],
            zorder=1,
        )
    )
# Add the fixed text
tp = topAt(imp["monthsWidth"] / 2)
lft = leftAt(1.0 - imp["yearHeight"] / 2)
ax_full.text(
    tp[0],
    lft[1],
    "Year",
    fontsize=imp["fontSize"],
    horizontalalignment="center",
    verticalalignment="center",
)
tp = topAt(1.0 - imp["meansWidth"] / 2)
lft = leftAt(1.0 - imp["yearHeight"] / 2)
ax_full.text(
    tp[0],
    lft[1],
    "Means",
    fontsize=imp["fontSize"],
    horizontalalignment="center",
    verticalalignment="center",
)
tp = topAt(imp["monthsWidth"] / 2)
lft = leftAt(imp["totalsHeight"] / 2)
ax_full.text(
    tp[0],
    lft[1],
    "Totals",
    fontsize=imp["fontSize"],
    horizontalalignment="center",
    verticalalignment="center",
)
months = (
    "January",
    "February",
    "March",
    "April",
    "May",
    "June",
    "July",
    "August",
    "September",
    "October",
    "November",
    "December",
)
tp = topAt(imp["monthsWidth"] / 10)
for mdx in range(len(months)):
    lft = leftAt(
        1.0
        - imp["yearHeight"]
        - (mdx + 1)
        * (1.0 - imp["yearHeight"] - imp["totalsHeight"])
        / (len(months) + 1)
    )
    ax_full.text(
        tp[0],
        lft[1],
        months[mdx],
        fontsize=imp["fontSize"] - 1,
        horizontalalignment="left",
        verticalalignment="center",
    )
lft = leftAt(1.0 - imp["yearHeight"] / 2)
for ydx in range(10):
    x = (
        imp["monthsWidth"]
        + (ydx + 0.5) * (1.0 - imp["meansWidth"] - imp["monthsWidth"]) / 10
    )
    tp = topAt(x)
    ax_full.text(
        tp[0],
        lft[1],
        "%04d" % (imp["year"] + ydx),
        fontsize=imp["fontSize"],
        horizontalalignment="center",
        verticalalignment="center",
    )

# Add the transcribed numbers
tidx = 0
for yri in range(10):
    x = (
        imp["monthsWidth"]
        + (yri + 0.5) * (1.0 - imp["meansWidth"] - imp["monthsWidth"]) / 10
    )
    tp = topAt(x)
    for mni in range(12):
        lft = leftAt(
            1.0
            - imp["yearHeight"]
            - (mni + 1)
            * (1.0 - imp["yearHeight"] - imp["totalsHeight"])
            / (len(months) + 1)
        )
        for dgi in range(3):
            ax_full.add_patch(
                matplotlib.patches.Rectangle(
                    (tp[0] - 0.015 + dgi * 0.015 - 0.005, lft[1] - 0.01),
                    0.01,
                    0.02,
                    fill=True,
                    facecolor=(0, 0, 0, 0.1),
                )
            )
            ax_full.add_patch(
                matplotlib.patches.Rectangle(
                    (tp[0] - 0.015 + dgi * 0.015 - 0.005, lft[1] - 0.01),
                    0.01,
                    0.02 * plmatrix[tidx],
                    fill=True,
                    facecolor="blue",
                )
            )
            tidx += 1
# Add the monthly means
tp = topAt(1.0 - imp["meansWidth"] / 2)
for mni in range(12):
    lft = leftAt(
        1.0
        - imp["yearHeight"]
        - (mni + 1)
        * (1.0 - imp["yearHeight"] - imp["totalsHeight"])
        / (len(months) + 1)
    )
    for dgi in range(3):
        ax_full.add_patch(
            matplotlib.patches.Rectangle(
                (tp[0] - 0.015 + dgi * 0.015 - 0.005, lft[1] - 0.01),
                0.01,
                0.02,
                fill=True,
                facecolor=(0, 0, 0, 0.1),
            )
        )
        ax_full.add_patch(
            matplotlib.patches.Rectangle(
                (tp[0] - 0.015 + dgi * 0.015 - 0.005, lft[1] - 0.01),
                0.01,
                0.02 * plmatrix[tidx],
                fill=True,
                facecolor="blue",
            )
        )
        tidx += 1
# Add the annual totals
lft = leftAt(imp["totalsHeight"] / 2)
for yri in range(10):
    x = (
        imp["monthsWidth"]
        + (yri + 0.5) * (1.0 - imp["meansWidth"] - imp["monthsWidth"]) / 10
    )
    tp = topAt(x)
    inr = 0.0
    for dgi in range(4):
        ax_full.add_patch(
            matplotlib.patches.Rectangle(
                (tp[0] - 0.0225 + dgi * 0.015 - 0.005, lft[1] - 0.01),
                0.01,
                0.02,
                fill=True,
                facecolor=(0, 0, 0, 0.1),
            )
        )
        ax_full.add_patch(
            matplotlib.patches.Rectangle(
                (tp[0] - 0.0225 + dgi * 0.015 - 0.005, lft[1] - 0.01),
                0.01,
                0.02 * plmatrix[tidx],
                fill=True,
                facecolor="blue",
            )
        )
        tidx += 1

# plot the single example
ax_encoded = fig.add_axes([0.5, -0.25, 0.5, 1])
ax_encoded.set_xlim([0, 1])
ax_encoded.set_ylim([0, 1])
ax_encoded.set_axis_off()

ax_encoded.add_line(
    Line2D(
        xdata=(topLeft[0], topRight[0], bottomRight[0], bottomLeft[0], topLeft[0]),
        ydata=(topLeft[1], topRight[1], bottomRight[1], bottomLeft[1], topLeft[1]),
        linestyle="solid",
        linewidth=imp["linewidth"],
        color=imp["fgcolour"],
        zorder=1,
    )
)

# Draw the grid
lft = leftAt(1.0 - imp["yearHeight"])
rgt = rightAt(1.0 - imp["yearHeight"])
ax_encoded.add_line(
    Line2D(
        xdata=(lft[0], rgt[0]),
        ydata=(lft[1], rgt[1]),
        linestyle="solid",
        linewidth=imp["linewidth"],
        color=imp["fgcolour"],
        zorder=1,
    )
)
lft = leftAt(imp["totalsHeight"])
rgt = rightAt(imp["totalsHeight"])
ax_encoded.add_line(
    Line2D(
        xdata=(lft[0], rgt[0]),
        ydata=(lft[1], rgt[1]),
        linestyle="solid",
        linewidth=imp["linewidth"],
        color=imp["fgcolour"],
        zorder=1,
    )
)
tp = topAt(imp["monthsWidth"])
bm = bottomAt(imp["monthsWidth"])
ax_encoded.add_line(
    Line2D(
        xdata=(tp[0], bm[0]),
        ydata=(tp[1], bm[1]),
        linestyle="solid",
        linewidth=imp["linewidth"],
        color=imp["fgcolour"],
        zorder=1,
    )
)
tp = topAt(1.0 - imp["meansWidth"])
bm = bottomAt(1.0 - imp["meansWidth"])
ax_encoded.add_line(
    Line2D(
        xdata=(tp[0], bm[0]),
        ydata=(tp[1], bm[1]),
        linestyle="solid",
        linewidth=imp["linewidth"],
        color=imp["fgcolour"],
        zorder=1,
    )
)
for yrl in range(1, 10):
    x = imp["monthsWidth"] + yrl * (1.0 - imp["meansWidth"] - imp["monthsWidth"]) / 10
    tp = topAt(x)
    bm = bottomAt(x)
    ax_encoded.add_line(
        Line2D(
            xdata=(tp[0], bm[0]),
            ydata=(tp[1], bm[1]),
            linestyle="solid",
            linewidth=imp["linewidth"],
            color=imp["fgcolour"],
            zorder=1,
        )
    )
# Add the fixed text
tp = topAt(imp["monthsWidth"] / 2)
lft = leftAt(1.0 - imp["yearHeight"] / 2)
ax_encoded.text(
    tp[0],
    lft[1],
    "Year",
    fontsize=imp["fontSize"],
    horizontalalignment="center",
    verticalalignment="center",
)
tp = topAt(1.0 - imp["meansWidth"] / 2)
lft = leftAt(1.0 - imp["yearHeight"] / 2)
ax_encoded.text(
    tp[0],
    lft[1],
    "Means",
    fontsize=imp["fontSize"],
    horizontalalignment="center",
    verticalalignment="center",
)
tp = topAt(imp["monthsWidth"] / 2)
lft = leftAt(imp["totalsHeight"] / 2)
ax_encoded.text(
    tp[0],
    lft[1],
    "Totals",
    fontsize=imp["fontSize"],
    horizontalalignment="center",
    verticalalignment="center",
)
months = (
    "January",
    "February",
    "March",
    "April",
    "May",
    "June",
    "July",
    "August",
    "September",
    "October",
    "November",
    "December",
)
tp = topAt(imp["monthsWidth"] / 10)
for mdx in range(len(months)):
    lft = leftAt(
        1.0
        - imp["yearHeight"]
        - (mdx + 1)
        * (1.0 - imp["yearHeight"] - imp["totalsHeight"])
        / (len(months) + 1)
    )
    ax_encoded.text(
        tp[0],
        lft[1],
        months[mdx],
        fontsize=imp["fontSize"] - 1,
        horizontalalignment="left",
        verticalalignment="center",
    )
lft = leftAt(1.0 - imp["yearHeight"] / 2)
for ydx in range(10):
    x = (
        imp["monthsWidth"]
        + (ydx + 0.5) * (1.0 - imp["meansWidth"] - imp["monthsWidth"]) / 10
    )
    tp = topAt(x)
    ax_encoded.text(
        tp[0],
        lft[1],
        "%04d" % (imp["year"] + ydx),
        fontsize=imp["fontSize"],
        horizontalalignment="center",
        verticalalignment="center",
    )

# Add the transcribed numbers
orig = origN
trnb = encN
tidx = 0
for yri in range(10):
    x = (
        imp["monthsWidth"]
        + (yri + 0.5) * (1.0 - imp["meansWidth"] - imp["monthsWidth"]) / 10
    )
    tp = topAt(x)
    for mni in range(12):
        lft = leftAt(
            1.0
            - imp["yearHeight"]
            - (mni + 1)
            * (1.0 - imp["yearHeight"] - imp["totalsHeight"])
            / (len(months) + 1)
        )
        for dgi in range(3):
            originalDigit = numpy.where(orig[tidx, :] == 1.0)[0]
            dgProbabilities = trnb[0, tidx, :]
            bestTranscribed = numpy.where(
                dgProbabilities == numpy.amax(dgProbabilities)
            )[0]
            colour = "red"
            if bestTranscribed == originalDigit:
                colour = "blue"
            ax_encoded.text(
                tp[0] - 0.015 + dgi * 0.015,
                lft[1],
                "%1d" % bestTranscribed,
                fontsize=imp["fontSize"],
                fontweight='bold',
                horizontalalignment="center",
                verticalalignment="center",
                color=colour,
            )
            tidx += 1
# Add the monthly means
tp = topAt(1.0 - imp["meansWidth"] / 2)
for mni in range(12):
    lft = leftAt(
        1.0
        - imp["yearHeight"]
        - (mni + 1)
        * (1.0 - imp["yearHeight"] - imp["totalsHeight"])
        / (len(months) + 1)
    )
    for dgi in range(3):
        originalDigit = numpy.where(orig[tidx, :] == 1.0)[0]
        dgProbabilities = trnb[0, tidx, :]
        bestTranscribed = numpy.where(dgProbabilities == numpy.amax(dgProbabilities))[0]
        colour = "red"
        if bestTranscribed == originalDigit:
            colour = "blue"
        ax_encoded.text(
            tp[0] - 0.015 + dgi * 0.015,
            lft[1],
            "%1d" % bestTranscribed,
            fontsize=imp["fontSize"],
            fontweight='bold',
            horizontalalignment="center",
            verticalalignment="center",
            color=colour,
        )
        tidx += 1
# Add the annual totals
lft = leftAt(imp["totalsHeight"] / 2)
for yri in range(10):
    x = (
        imp["monthsWidth"]
        + (yri + 0.5) * (1.0 - imp["meansWidth"] - imp["monthsWidth"]) / 10
    )
    tp = topAt(x)
    inr = 0.0
    for dgi in range(4):
        originalDigit = numpy.where(orig[tidx, :] == 1.0)[0]
        dgProbabilities = trnb[0, tidx, :]
        bestTranscribed = numpy.where(dgProbabilities == numpy.amax(dgProbabilities))[0]
        colour = "red"
        if bestTranscribed == originalDigit:
            colour = "blue"
        ax_encoded.text(
            tp[0] - 0.0225 + dgi * 0.015,
            lft[1],
            "%1d" % bestTranscribed,
            fontsize=imp["fontSize"],
            fontweight='bold',
            horizontalalignment="center",
            verticalalignment="center",
            color=colour,
        )
        tidx += 1

# Render the figure as a png
fig.savefig("%s/ML_ATB2/models/tuned_convolutional_transcriber/video/%04d.png" % (os.getenv('SCRATCH'),int(args.epoch*100)))