How homogenous is 20CRv3?
20CRv3 is designed with long-term homogeneity in mind, and ideally we’d expect a homogenous dataset all the way back to 1850 and before. But realistically there are going to be limitations. One problem is model bias - in recent years, where observations are plentiful, the reanalysis follows the observations closely, but longer ago, where there are very few observations, the reanalysis is more of a model simulation, and so model bias is likely to be more important. Another problem is that the boundary conditions for the reanalysis (sea-surface temperature, sea-ice, surface pressure) are likely to be less reliable early on, and this will lead to inhomogeneities in the reanalysis fields.
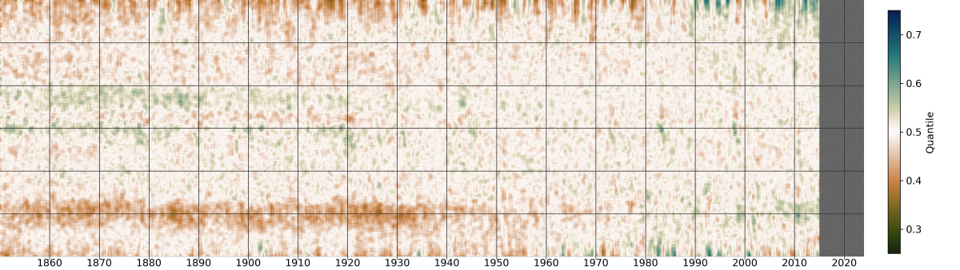
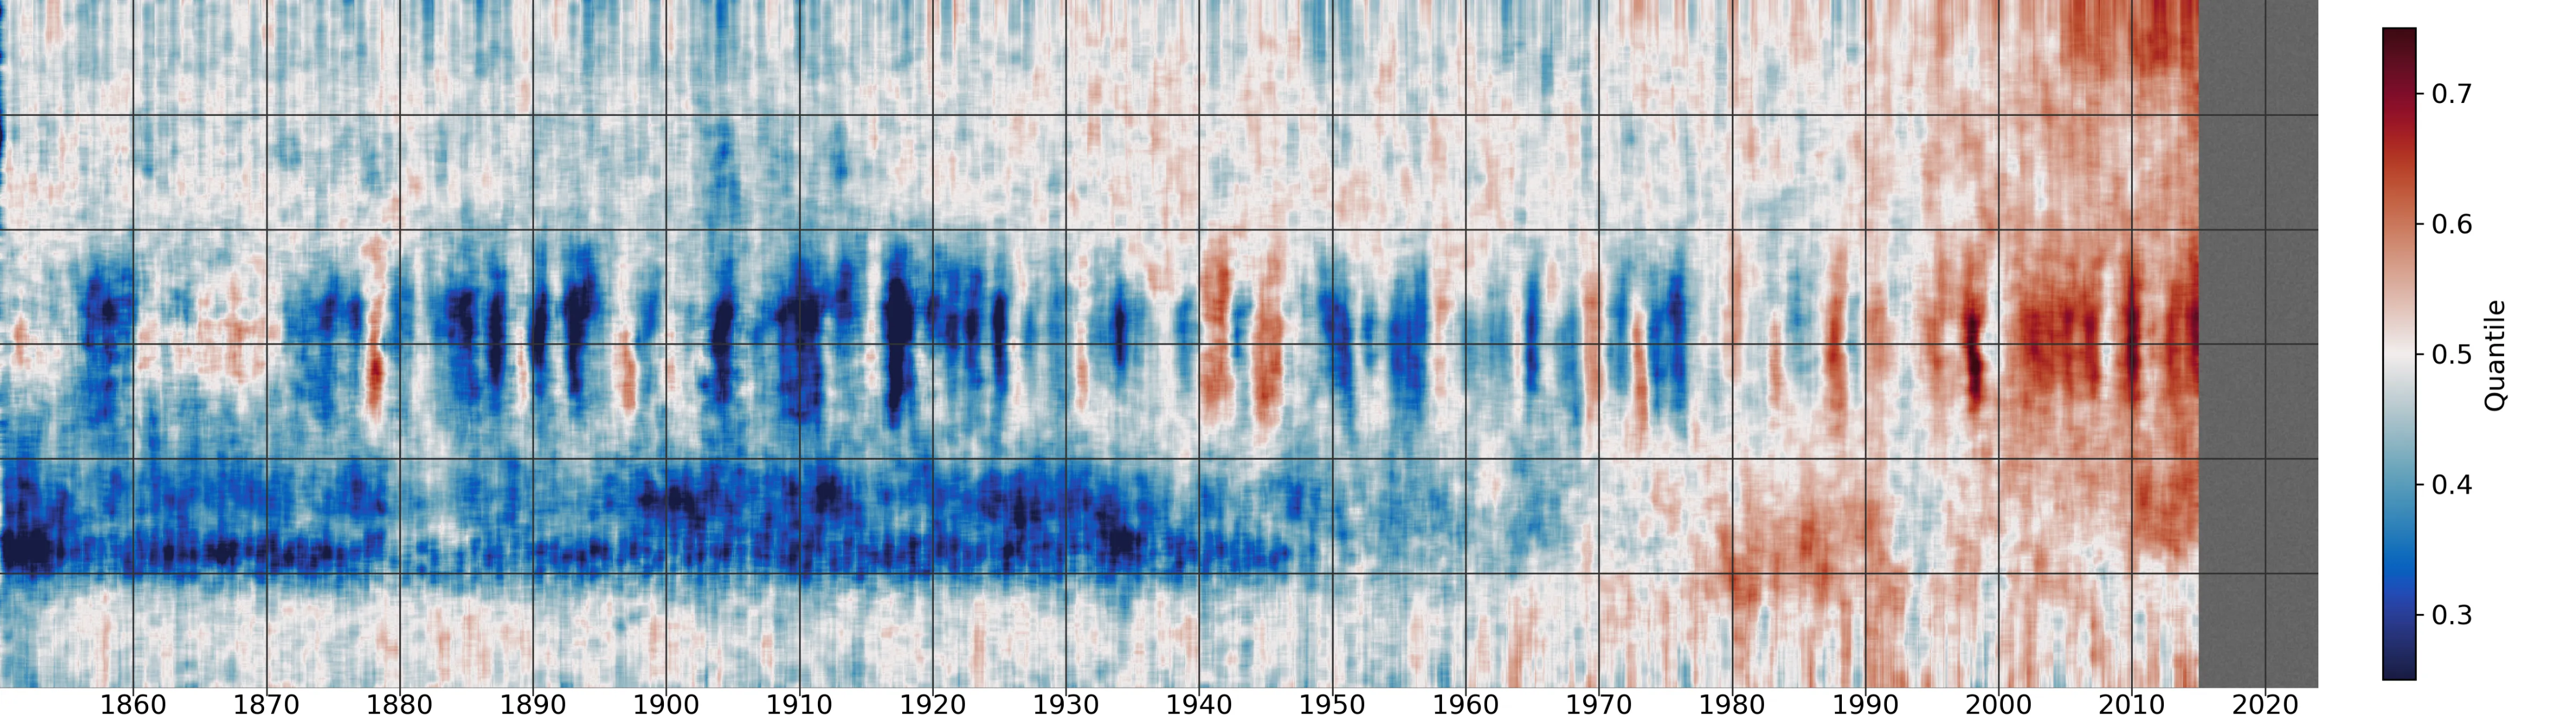
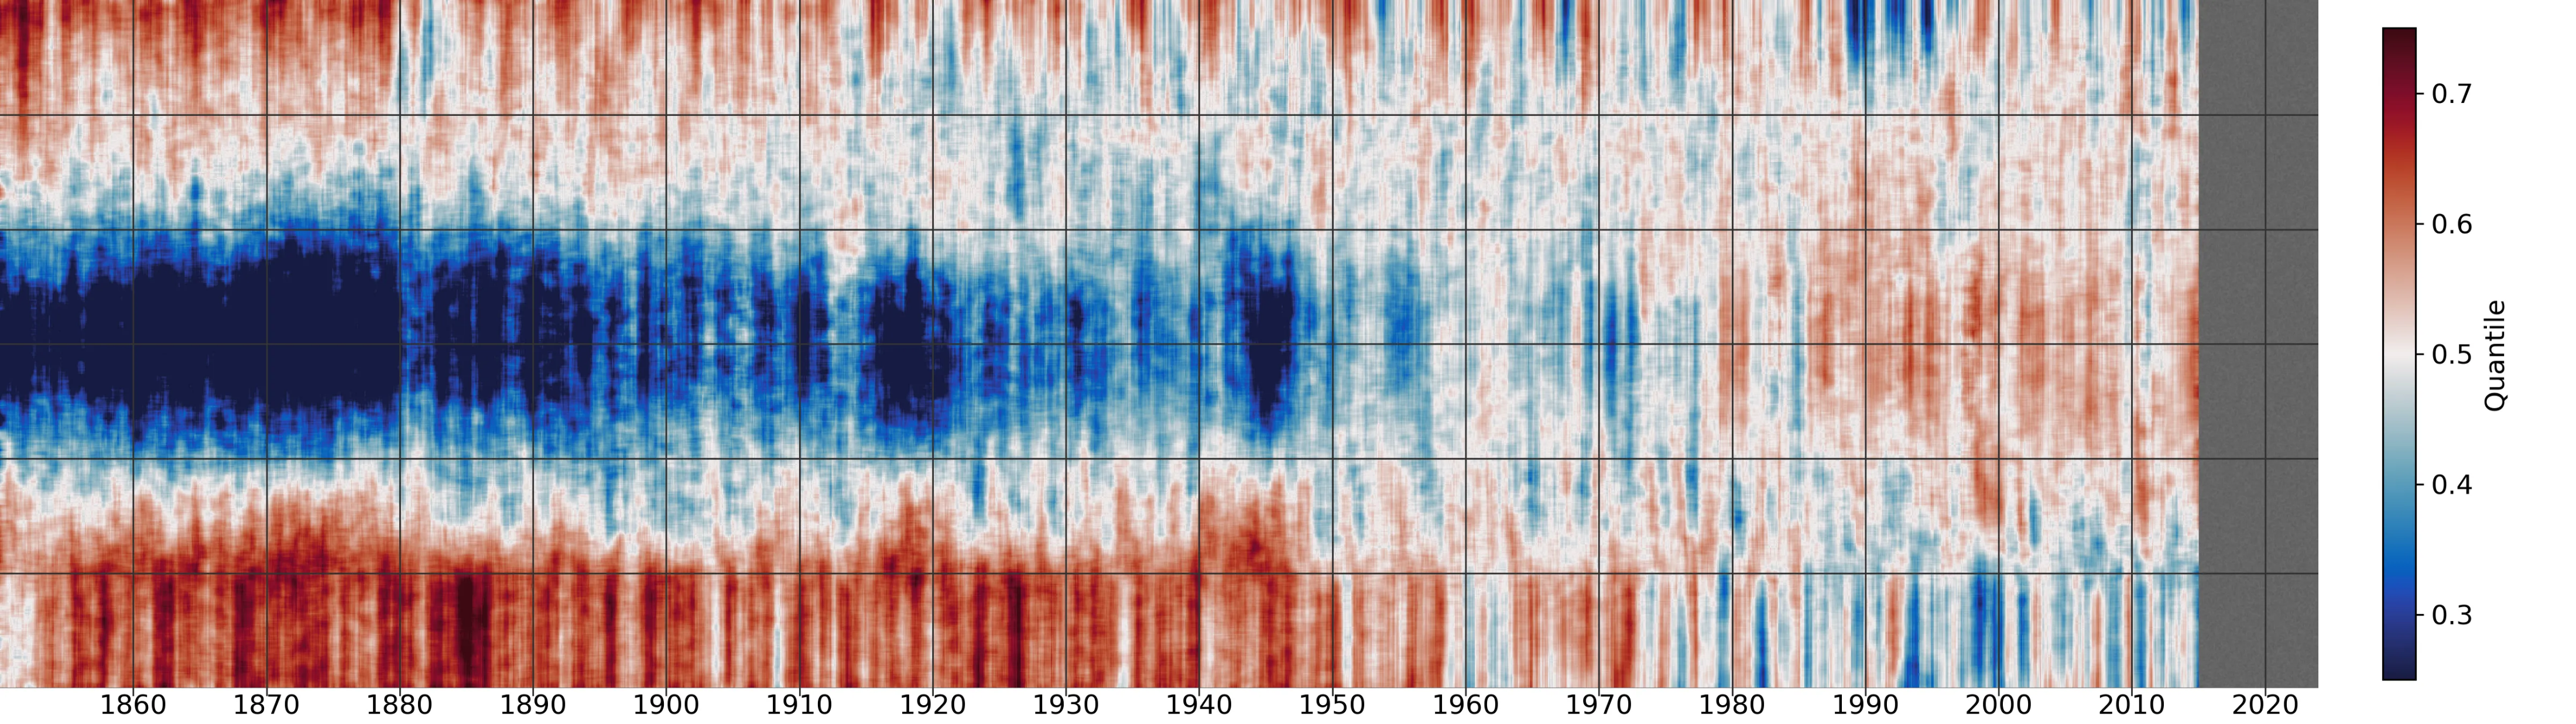
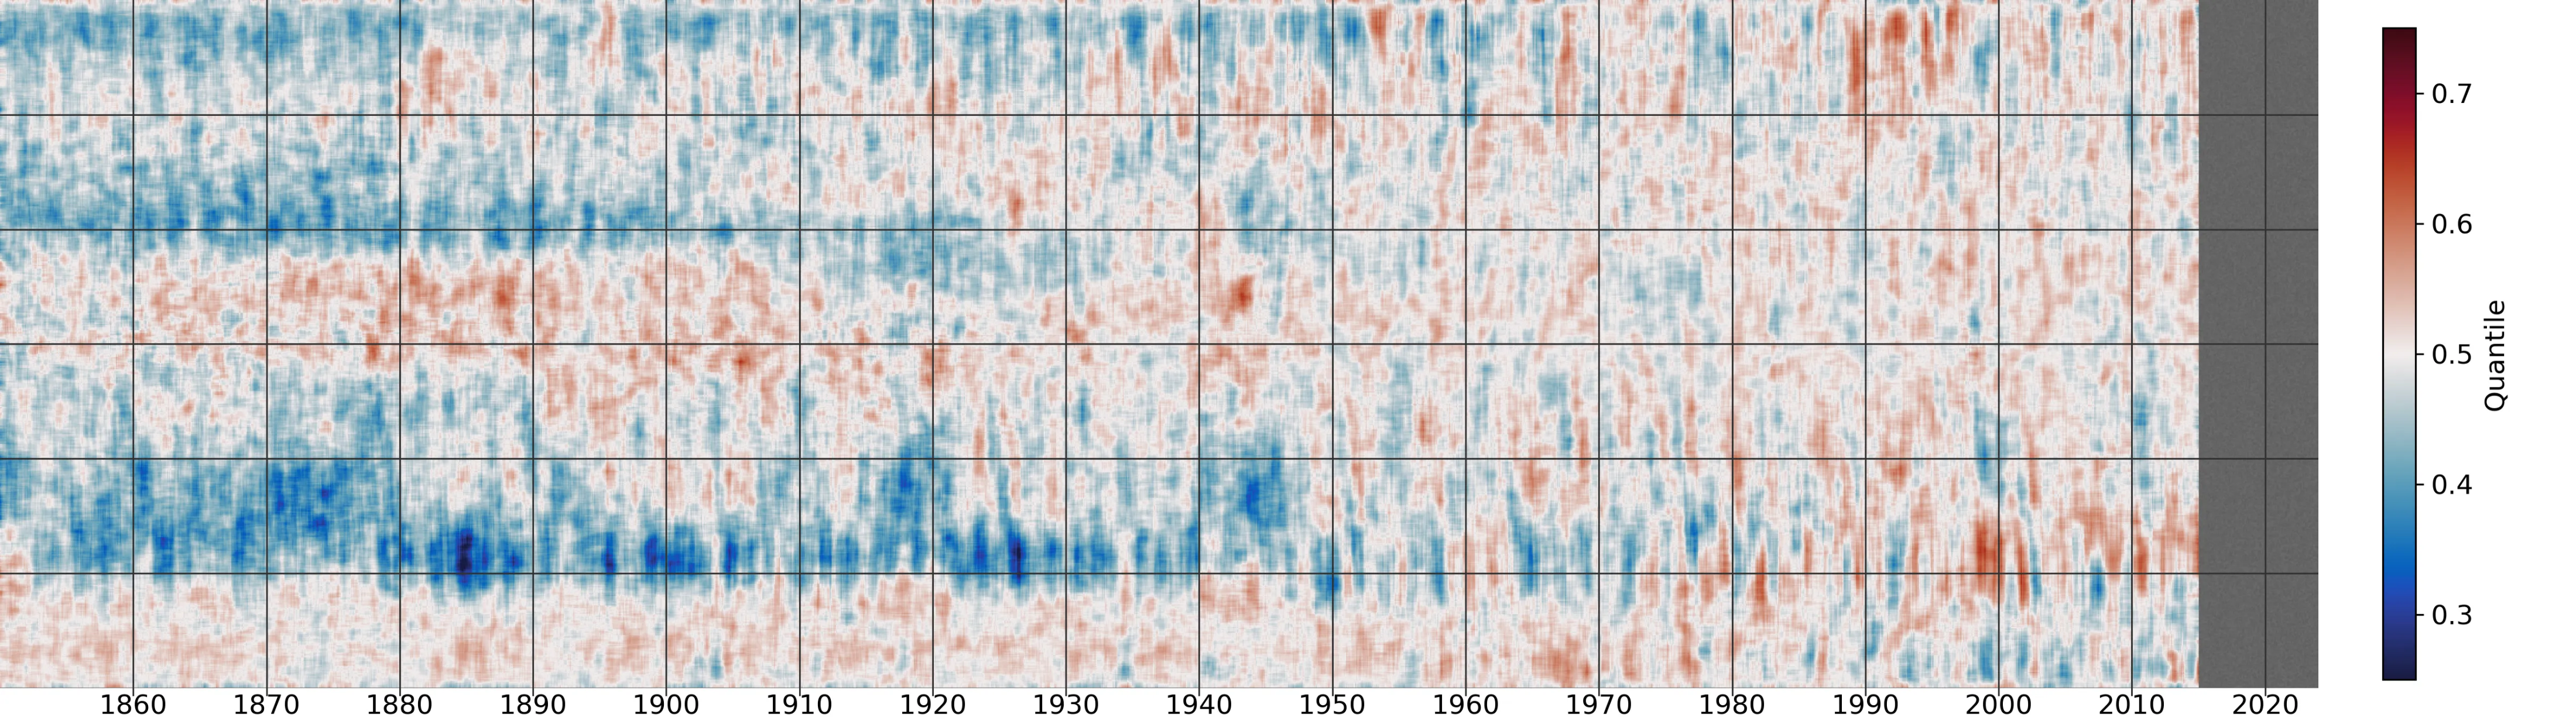
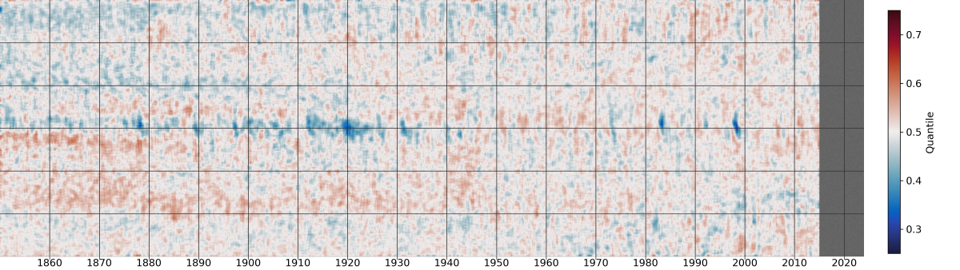
We can look at the homogeneity of 20CRv3 by making normalized extended-stripes plots of the variables of interest:
PRATE
TMP2m
PRMSL
UGRD10m
VGRD10m
RH2m
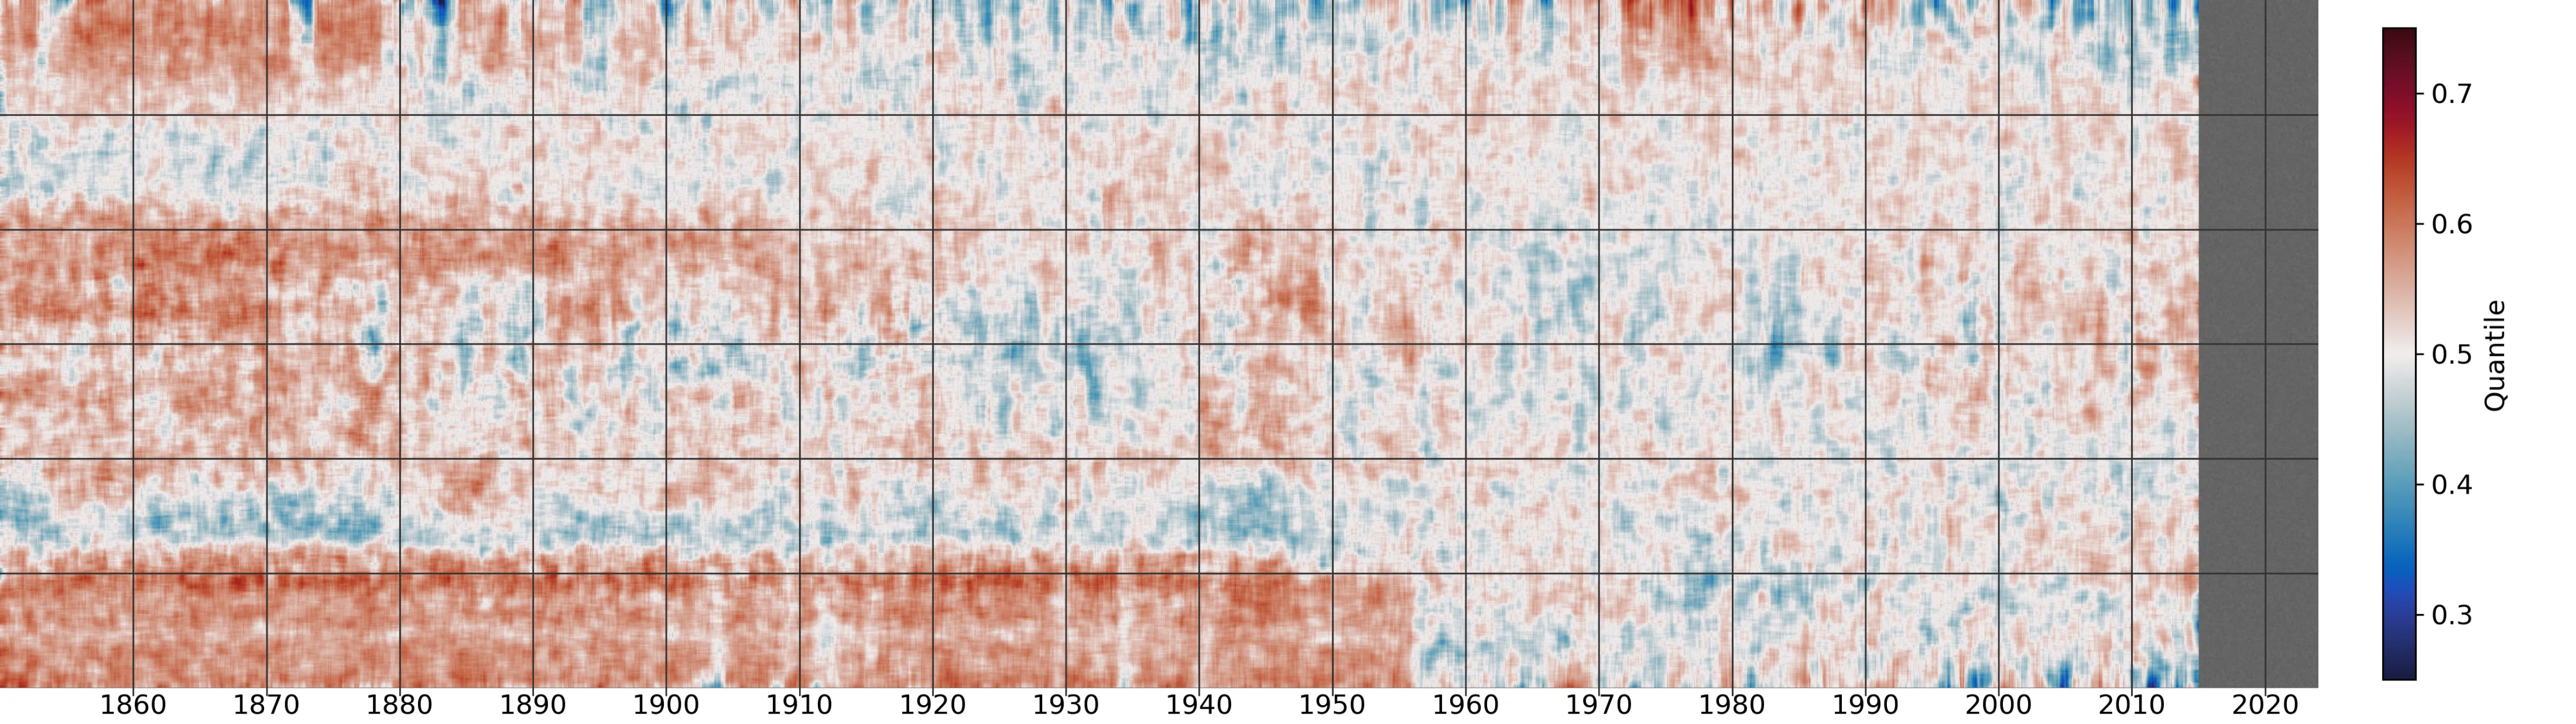
In these figures, we can see a mixture of real signals (climate change, ENSO, weather variability) and inhomogeneities (the strong cooling and drying in the Southern Ocean, large tropical warming in the mid-20th century, …). Both real signals and inhomogeneities are present throughout the dataset, but the inhomogeneities dominate before about 1950.