Fitting an XGBoost model to the TWCR data
One use for the ML model of precipitation is to investigate the internal consistency of 20CRv3. If we fit the model to recent data (here 1990-2014) we will get a model which can represents the relationship between precipitation and the surface variables in the reanalysis. If the relationship between the surface variables is stable over time, then the model should produce a similarly good prediction of reanalysis precipitation for the whole period of the reanalysis, and the time-series of global mean precipitation from the model should look similar to the time-series of global mean precipitation from the reanalysis. If there are changes in the accuracy of the model, over the period of the reanalysis, this means there are changes in the relationships between the reanalysis surface variables, and this is a sign of inhomogeneity in the reanalysis.
Testing the model fit suggests that it’s pretty good.
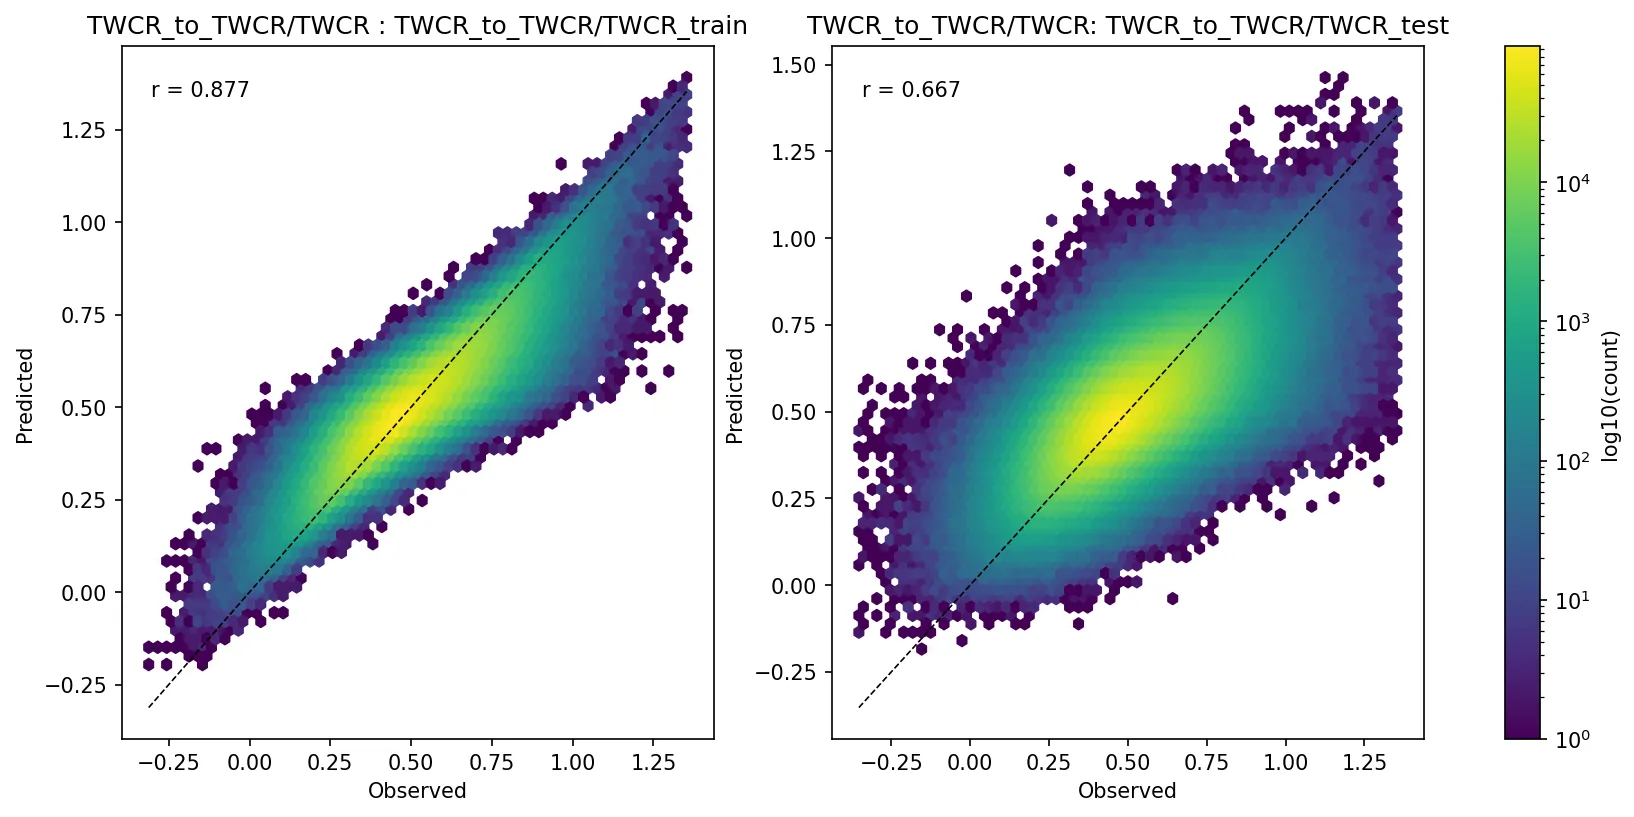
Validation plots for an XGBoost model trained to predict precipitation from a set of surface variables (temperature, humidity, pressure, latitude, longitude, calendar month). Left scatter plot shows performance on the training dataset, right scatter plot shows performance on the test dataset. (Figure source).
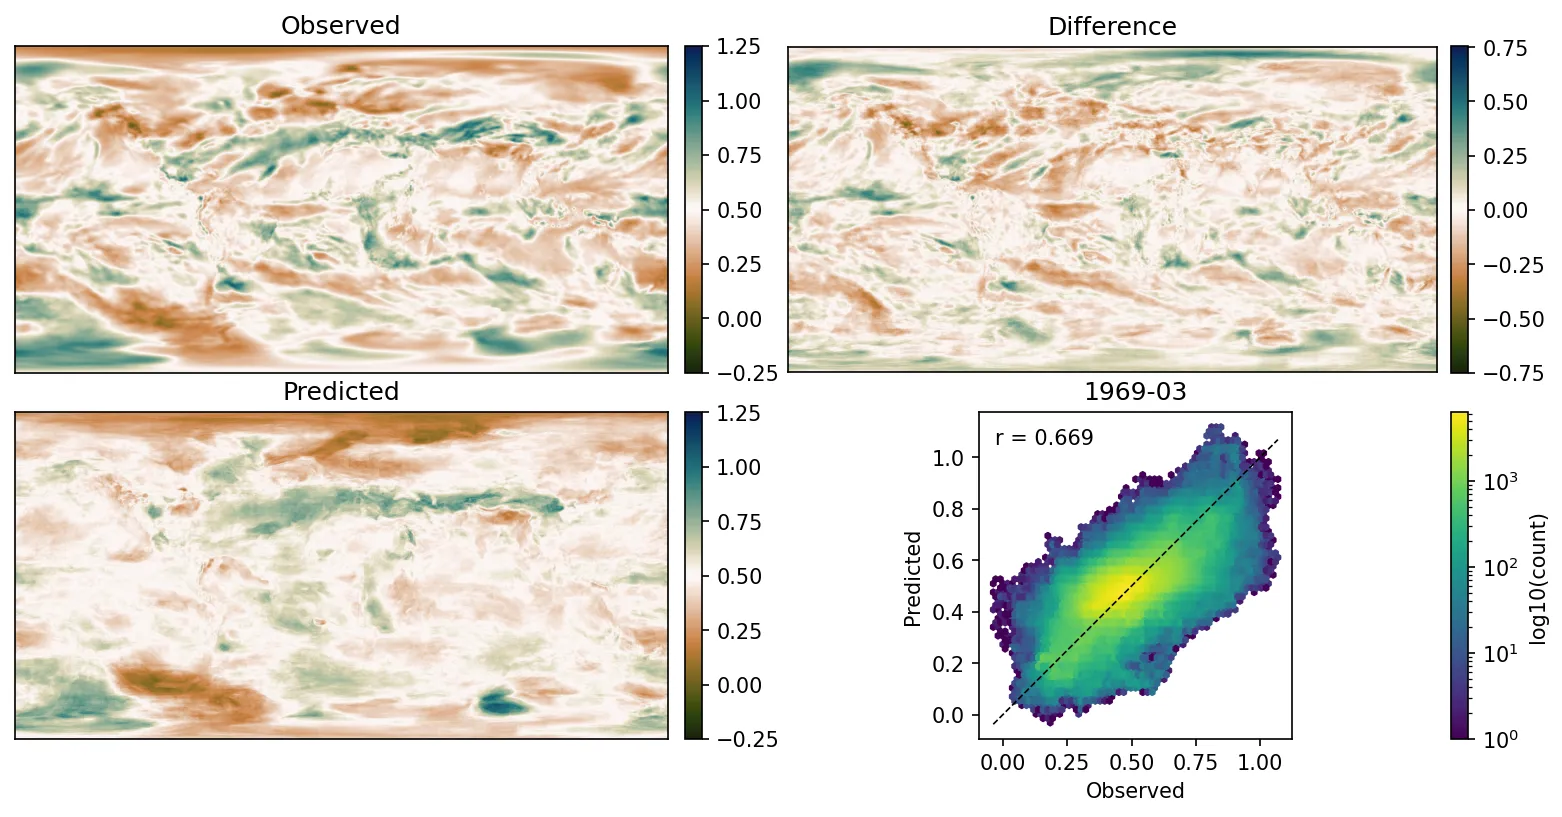
Precipitation field for one month as reconstructed by the model. (Figure source).
But the time-series comparison is much more interesting. The model fits well over the training period (1990-2014), and extrapolates well to the previous few decades (1950 on), but there is a systematic offset before about 1940, and a large offset around the period of the second world war - indicating inhomogeneities in these periods. This result isn’t that surprising - the known uncertainties in surface temperature - in HadISST - have exactly this pattern.
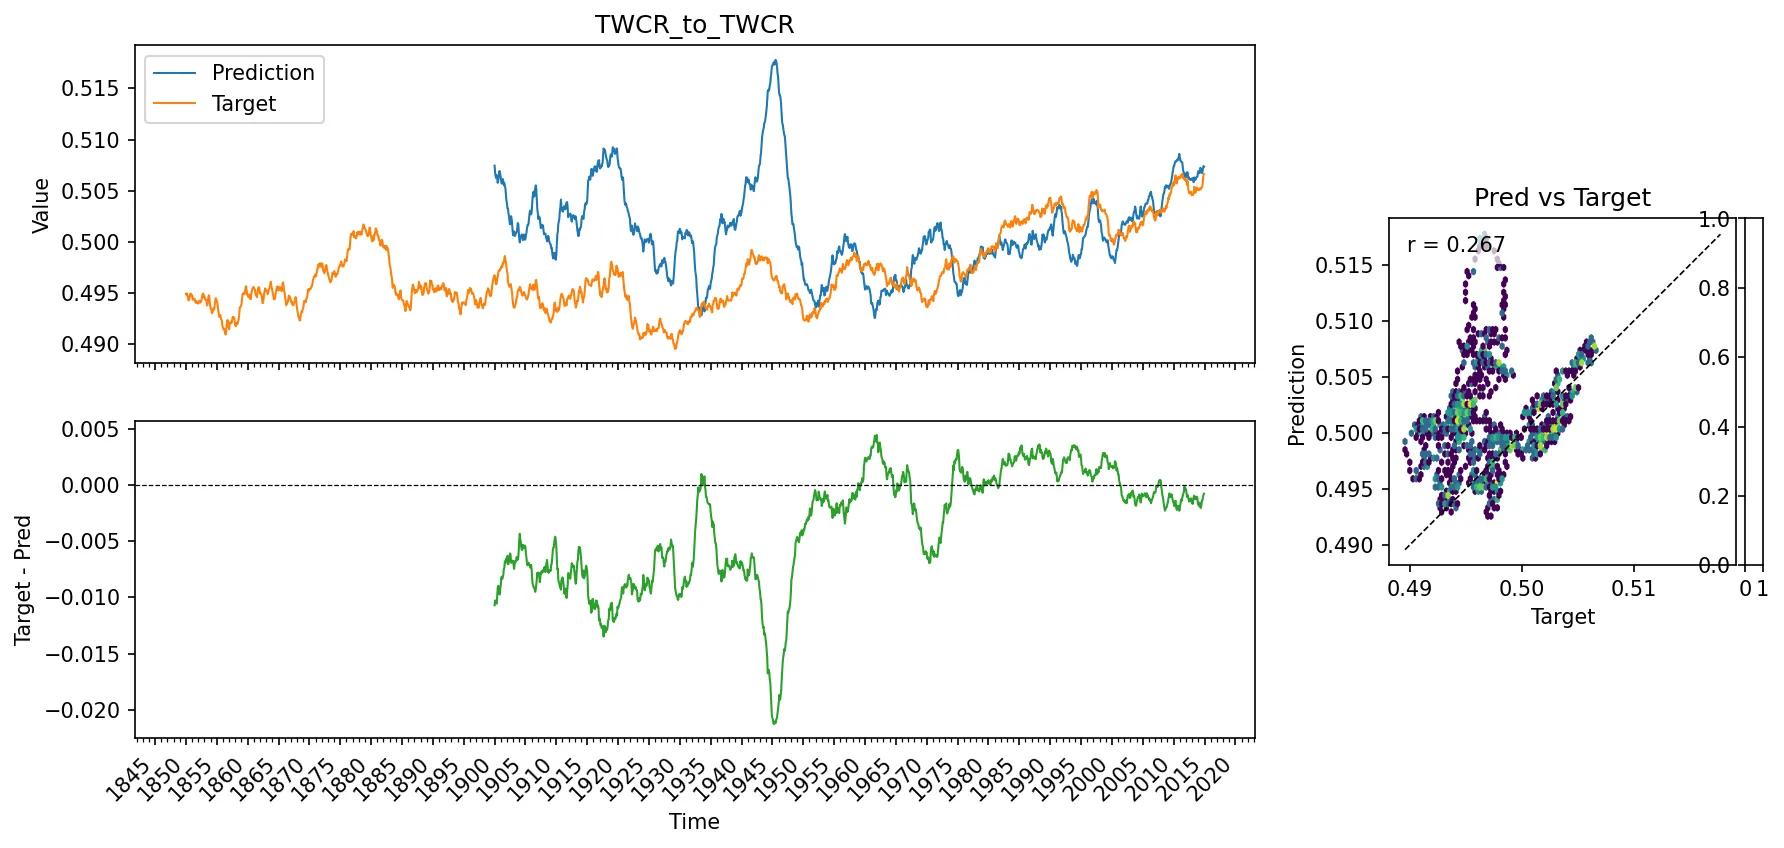
Global mean precipitation time-series as predicted by the model. (Figure source).
Normalised extended stripes plots of the modelled precipitation field show the same pattern but with more detail - since about 1950 the model fit is decent, but before then the combination of model bias and problems with the reanalysis boundary conditions (SST, sea-ice, surface pressure observations) leads to a poor fit. There is also a large model discrepancy in about 1945, which is probably a reflection of problems with SST boundary conditions in the reanalysis at this time.
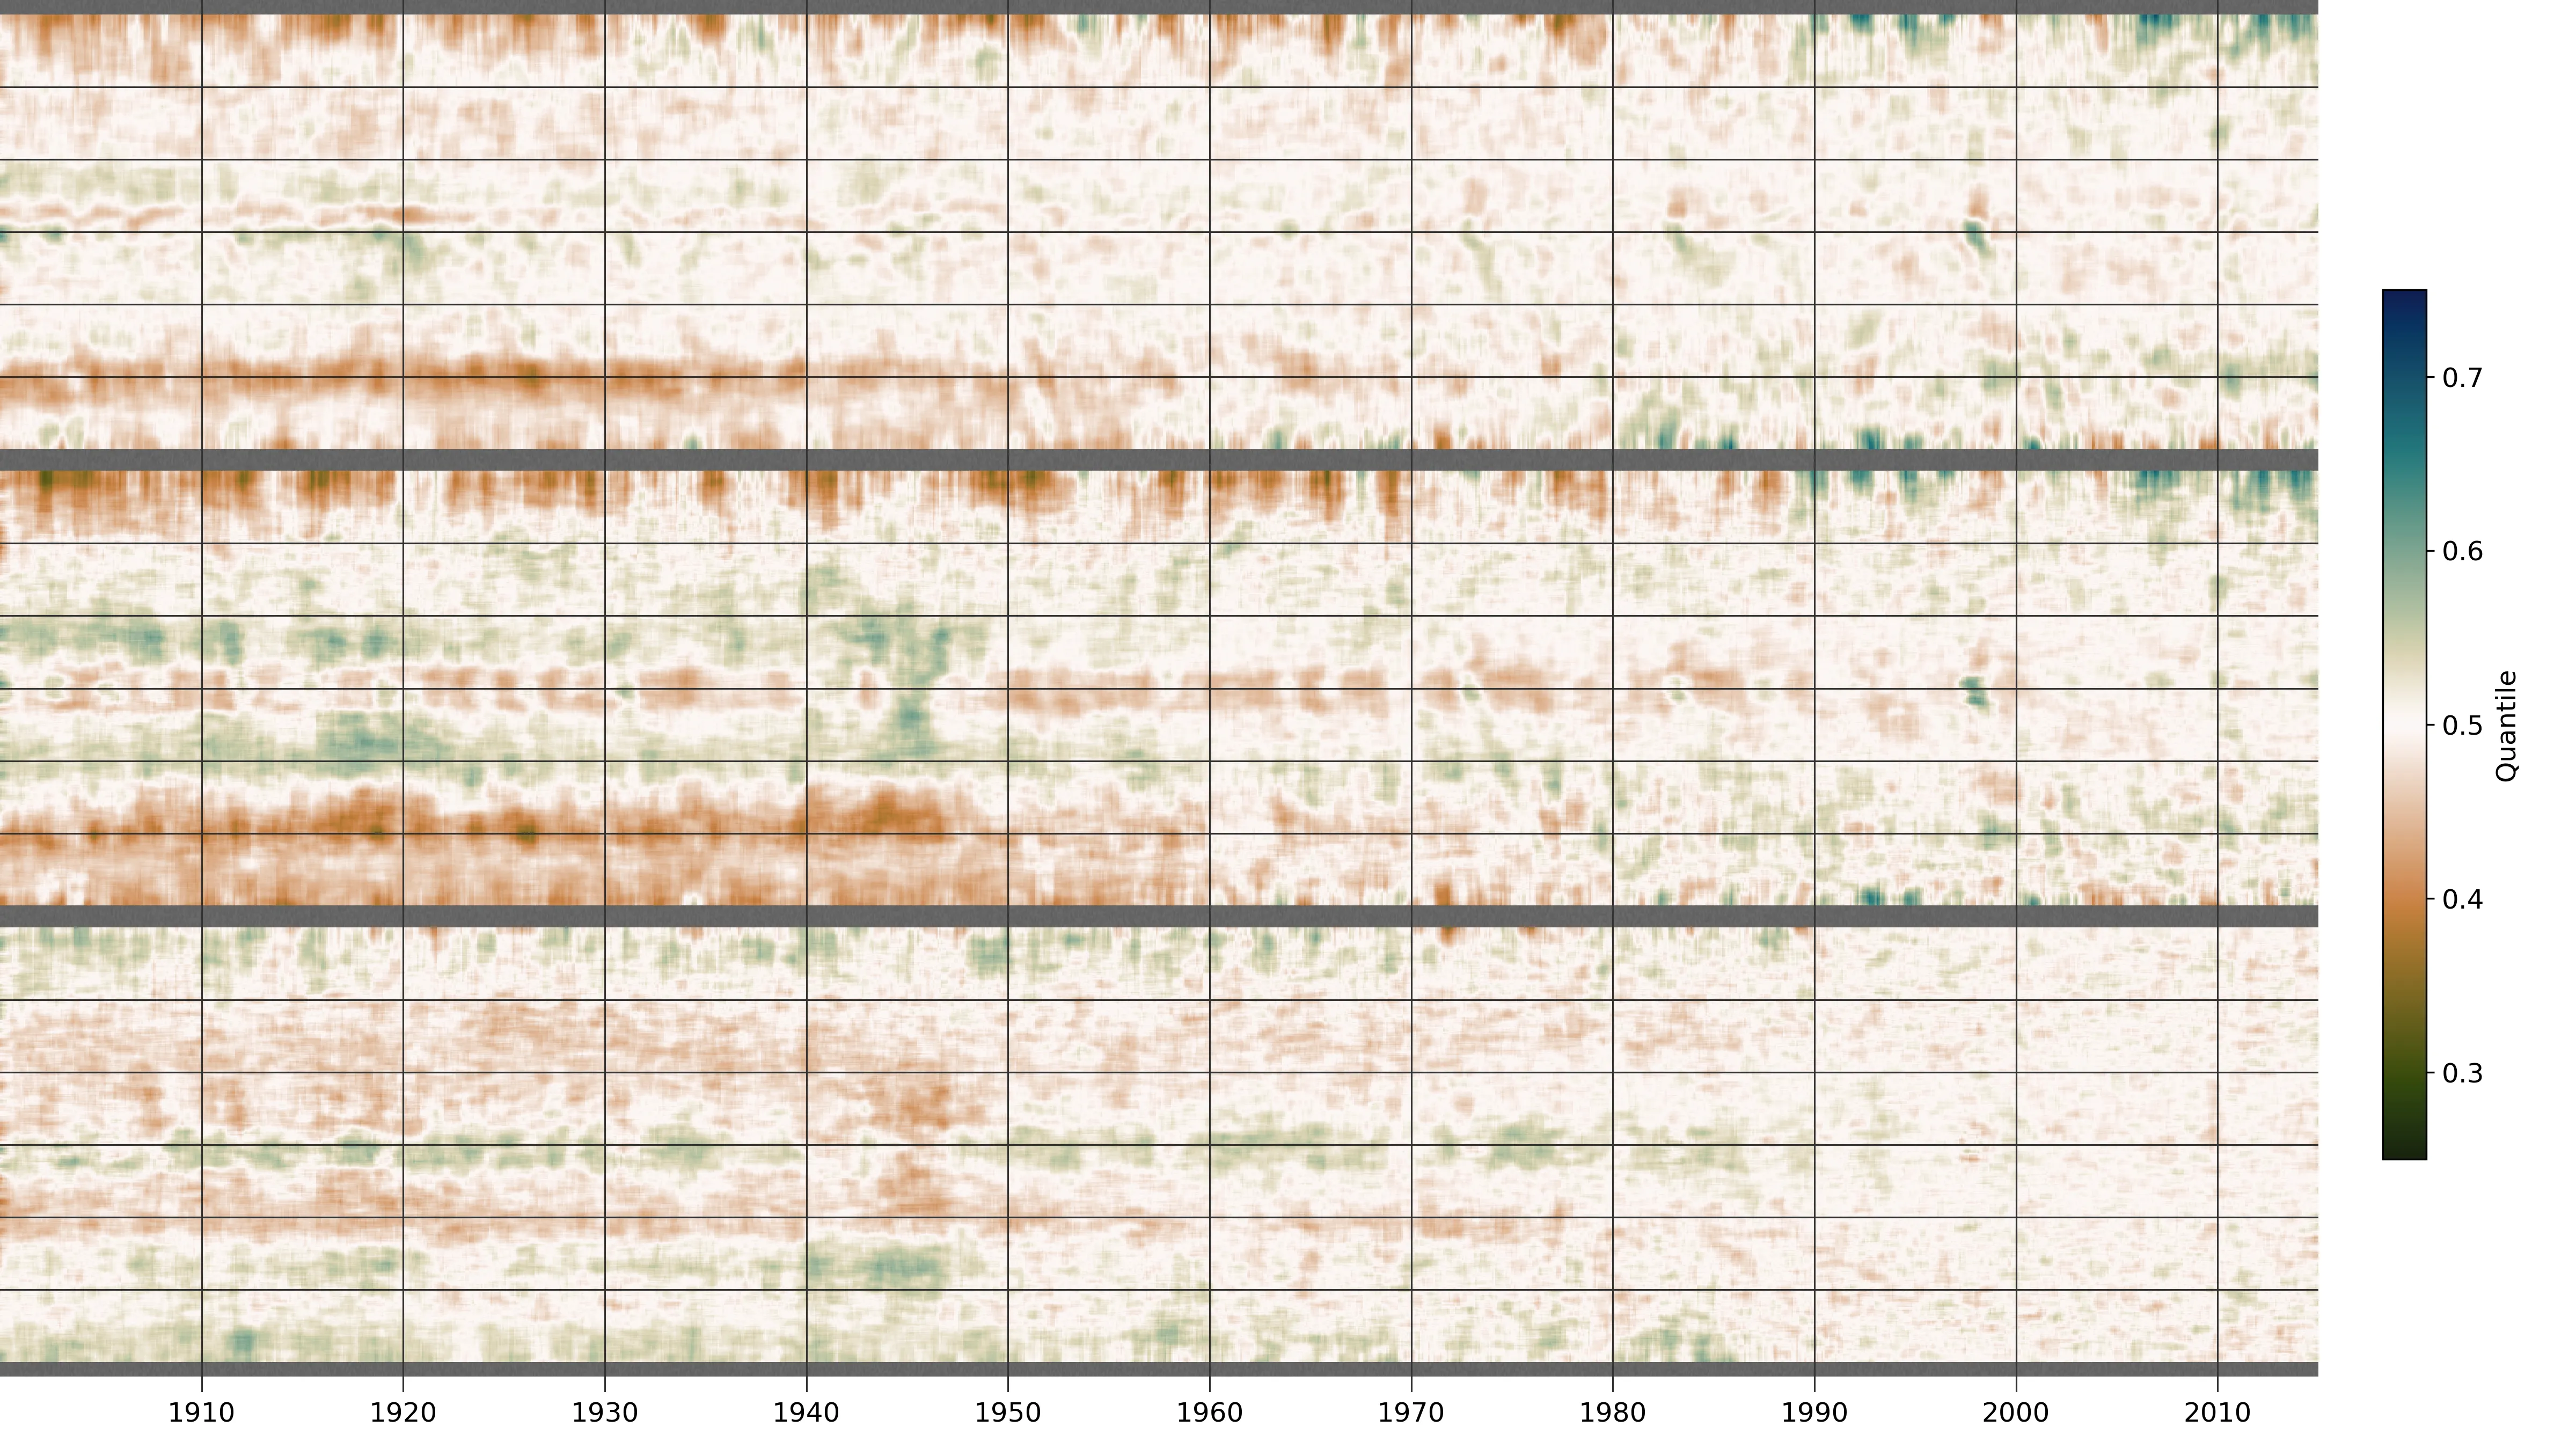
Extended-stripes plots of precipitation. Top row - target (TWCR precipitation), middle row - model prediction, bottom row - difference (Figure source).
This suggests that we can usefully use surface datasets from 20CR as a constraint on estimated precipitation, at least at the glovbal scale, since about 1950.