A convolutional autoencoder
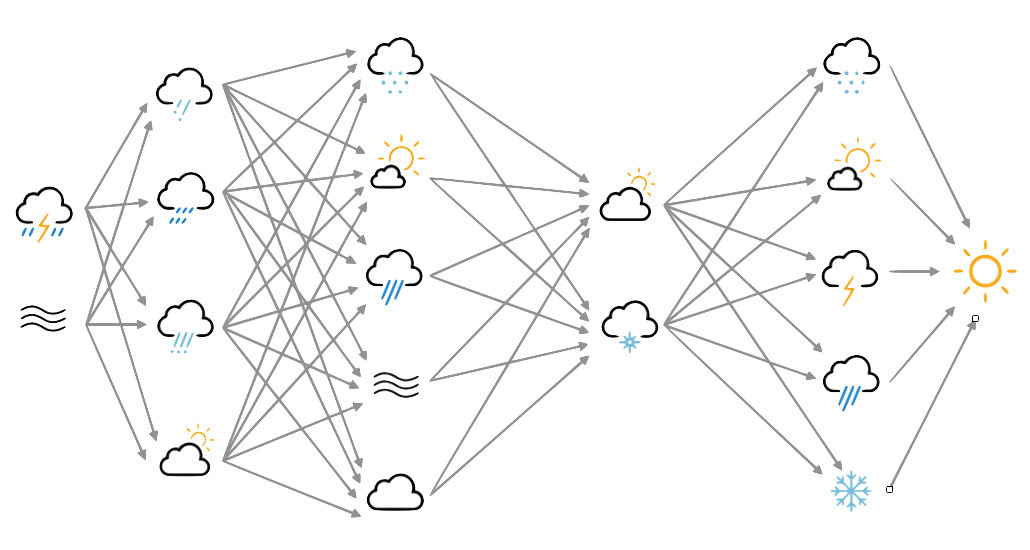
Again inspired by Vikram Tiwari’s tf.keras Autoencoder page, we can try a convolutional autoencoder. Like the deep autoencoder, this has several hidden layers and Leaky-ReLU activations, but the layers are convolutional, rather than fully connected.
Convolutional layers look at spatially-connected clusters of grid-cells together. This introduces a complication for maps of geospatial data, as they have periodic boundary conditions in longitude, and complications at the poles. Also, convolutional layers are usually paired with pooling layers, and an autoencoder using pooling and upsampling requires a grid resolution which divides exactly by the amount of pooling - this example has 3 2x2 pooling layers, so we need both x and y field sizes to be divisible by 8 (2^3). To deal with this I have written new layers to add and remove periodic-boundary-condition padding along the longitude split, and to resize the data grids. (I’m not worrying about the poles for the moment).
#!/usr/bin/env python

# Convolutional autoencoder for 20CR prmsl fields.

import os
import tensorflow as tf
import ML_Utilities
import pickle
import numpy

# How many epochs to train for
n_epochs=50

# Create TensorFlow Dataset object from the prepared training data
(tr_data,n_steps) = ML_Utilities.dataset(purpose='training',
                                         source='20CR2c',
                                         variable='prmsl')
tr_data = tr_data.repeat(n_epochs)

# Need to reshape the data to have both dimensions divisible by 8 (3*2-fold pool).
# Also produce a tuple (source,target) for model
def to_model(ict):
   ict=tf.reshape(ict,[91,180,1])
   #ict=tf.image.resize_images(ict, (32, 64),
   #                           align_corners=True)
   return(ict,ict)
tr_data = tr_data.map(to_model)
tr_data = tr_data.batch(1)

# Similar dataset from the prepared test data
(tr_test,test_steps) = ML_Utilities.dataset(purpose='test',
                                            source='20CR2c',
                                            variable='prmsl')
tr_test = tr_test.repeat(n_epochs)
tr_test = tr_test.map(to_model)
tr_test = tr_test.batch(1)

# Need to resize data so it's dimensions are a multiple of 8 (3*2-fold pool)
class ResizeLayer(tf.keras.layers.Layer):
   def __init__(self, newsize=None, **kwargs):
      super(ResizeLayer, self).__init__(**kwargs)
      self.resize_newsize = newsize
   def call(self, input):
      return tf.image.resize_images(input, self.resize_newsize,
                                    align_corners=True)
   def get_config(self):
      return {'newsize': self.resize_newsize}

# Padding and pruning functions for periodic boundary conditions
class LonPadLayer(tf.keras.layers.Layer):
   def __init__(self, index=3, padding=8, **kwargs):
      super(LonPadLayer, self).__init__(**kwargs)
      self.lon_index = index
      self.lon_padding = padding
   def build(self, input_shape):
      self.lon_tile_spec=numpy.repeat(1,len(input_shape))
      self.lon_tile_spec[self.lon_index-1]=3
      self.lon_expansion_slice=[slice(None, None, None)]*len(input_shape)
      self.lon_expansion_slice[self.lon_index-1]=slice(
                                input_shape[self.lon_index-1].value-self.lon_padding,
                                input_shape[self.lon_index-1].value*2+self.lon_padding,
                                None)
      self.lon_expansion_slice=tuple(self.lon_expansion_slice)
   def call(self, input):
      return tf.tile(input, self.lon_tile_spec)[self.lon_expansion_slice]
   def get_config(self):
      return {'index': self.lon_index}
      return {'padding': self.lon_padding}
class LonPruneLayer(tf.keras.layers.Layer):
   def __init__(self, index=3, padding=8, **kwargs):
      super(LonPruneLayer, self).__init__(**kwargs)
      self.lon_index = index
      self.lon_padding = padding
   def build(self, input_shape):
      self.lon_prune_slice=[slice(None, None, None)]*len(input_shape)
      self.lon_prune_slice[self.lon_index-1]=slice(
                                self.lon_padding,
                                input_shape[self.lon_index-1].value-self.lon_padding,
                                None)
      self.lon_prune_slice=tuple(self.lon_prune_slice)
   def call(self, input):
     return input[self.lon_prune_slice]
   def get_config(self):
      return {'index': self.lon_index}
      return {'padding': self.lon_padding}

# Input placeholder
original = tf.keras.layers.Input(shape=(91,180,1,))
# Resize to have dimesions divisible by 8
resized = ResizeLayer(newsize=(80,160))(original)
# Wrap-around in longitude for periodic boundary conditions
padded = LonPadLayer(padding=8)(resized)
# Encoding layers
x = tf.keras.layers.Conv2D(16, (3, 3), padding='same')(padded)
x = tf.keras.layers.LeakyReLU()(x)
x = tf.keras.layers.MaxPooling2D((2, 2), padding='same')(x)
x = tf.keras.layers.Conv2D(8, (3, 3), padding='same')(x)
x = tf.keras.layers.LeakyReLU()(x)
x = tf.keras.layers.MaxPooling2D((2, 2), padding='same')(x)
x = tf.keras.layers.Conv2D(8, (3, 3), padding='same')(x)
x = tf.keras.layers.LeakyReLU()(x)
encoded = tf.keras.layers.MaxPooling2D((2, 2), padding='same')(x)

# Decoding layers
x = tf.keras.layers.Conv2D(8, (3, 3), padding='same')(encoded)
x = tf.keras.layers.LeakyReLU()(x)
x = tf.keras.layers.UpSampling2D((2, 2))(x)
x = tf.keras.layers.Conv2D(8, (3, 3), padding='same')(x)
x = tf.keras.layers.LeakyReLU()(x)
x = tf.keras.layers.UpSampling2D((2, 2))(x)
x = tf.keras.layers.Conv2D(16, (3, 3), padding='same')(x)
x = tf.keras.layers.LeakyReLU()(x)
x = tf.keras.layers.UpSampling2D((2, 2))(x)
decoded = tf.keras.layers.Conv2D(1, (3, 3), padding='same')(x)
# Strip the longitude wrap-around
pruned=LonPruneLayer(padding=8)(decoded)
# Restore to original dimensions
outsize=ResizeLayer(newsize=(91,180))(pruned)

# Model relating original to output
autoencoder = tf.keras.models.Model(original,outsize)
# Choose a loss metric to minimise (RMS)
#  and an optimiser to use (adadelta)
autoencoder.compile(optimizer='adadelta', loss='mean_squared_error')

# Train the autoencoder
history=autoencoder.fit(x=tr_data,
                epochs=n_epochs,
                steps_per_epoch=n_steps,
                validation_data=tr_test,
                validation_steps=test_steps,
                verbose=2) # One line per epoch

# Save the model
save_file=("%s/Machine-Learning-experiments/"+
           "convolutional_autoencoder/"+
           "saved_models/Epoch_%04d") % (
                 os.getenv('SCRATCH'),n_epochs)
if not os.path.isdir(os.path.dirname(save_file)):
    os.makedirs(os.path.dirname(save_file))
tf.keras.models.save_model(autoencoder,save_file)
history_file=("%s/Machine-Learning-experiments/"+
              "convolutional_autoencoder/"+
              "saved_models/history_to_%04d.pkl") % (
                 os.getenv('SCRATCH'),n_epochs)
pickle.dump(history.history, open(history_file, "wb"))
For representing MSLP fields, convolution is the way to go: this autoencoder works dramatically better than the simple or deep versions.
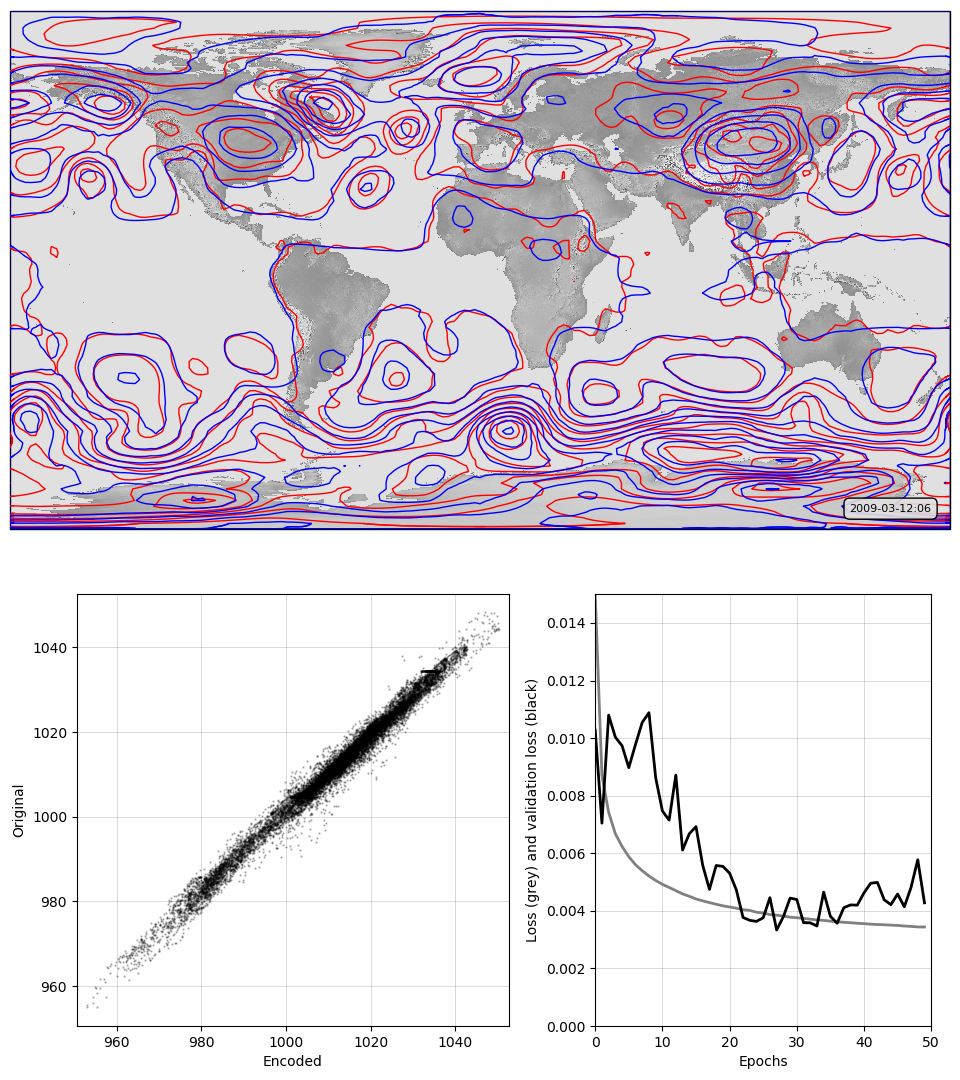
Top, a sample pressure field: Original in red, after passing through the autoencoder in blue. Bottom, a scatterplot of original v. encoded pressures for the sample field, and a graph of training progress: Loss v. no. of training epochs.
Script to make the figure
#!/usr/bin/env python

# Model training results plot

import tensorflow as tf
tf.enable_eager_execution()
import numpy

import IRData.twcr as twcr
import iris
import datetime
import argparse
import os
import math
import pickle

import Meteorographica as mg

import matplotlib
from matplotlib.backends.backend_agg import FigureCanvasAgg as FigureCanvas
from matplotlib.figure import Figure
import cartopy
import cartopy.crs as ccrs

# Get the 20CR data
ic=twcr.load('prmsl',datetime.datetime(2009,3,12,18),
                           version='2c')
ic=ic.extract(iris.Constraint(member=1))

# Need to resize data so it's dimensions are a multiple of 8 (3*2-fold pool)
class ResizeLayer(tf.keras.layers.Layer):
   def __init__(self, newsize=None, **kwargs):
      super(ResizeLayer, self).__init__(**kwargs)
      self.resize_newsize = newsize
   def build(self, input_shape):
      self.resize_newsize *= 1
   def call(self, input):
      return tf.image.resize_images(input, self.resize_newsize,
                                    align_corners=True)
   def get_config(self):
      return {'newsize': self.resize_newsize}

# Padding and pruning functions for periodic boundary conditions
class LonPadLayer(tf.keras.layers.Layer):
   def __init__(self, index=3, padding=8, **kwargs):
      super(LonPadLayer, self).__init__(**kwargs)
      self.lon_index = index
      self.lon_padding = padding
   def build(self, input_shape):
      self.lon_tile_spec=numpy.repeat(1,len(input_shape))
      self.lon_tile_spec[self.lon_index-1]=3
      self.lon_expansion_slice=[slice(None, None, None)]*len(input_shape)
      self.lon_expansion_slice[self.lon_index-1]=slice(
                                input_shape[self.lon_index-1].value-self.lon_padding,
                                input_shape[self.lon_index-1].value*2+self.lon_padding,
                                None)
      self.lon_expansion_slice=tuple(self.lon_expansion_slice)
   def call(self, input):
     return tf.tile(input, self.lon_tile_spec)[self.lon_expansion_slice]
   def get_config(self):
      return {'index': self.lon_index}
      return {'adding': self.lon_padding}
class LonPruneLayer(tf.keras.layers.Layer):
   def __init__(self, index=3, padding=8, **kwargs):
      super(LonPruneLayer, self).__init__(**kwargs)
      self.lon_index = index
      self.lon_padding = padding
   def build(self, input_shape):
      self.lon_prune_slice=[slice(None, None, None)]*len(input_shape)
      self.lon_prune_slice[self.lon_index-1]=slice(
                                self.lon_padding,
                                input_shape[self.lon_index-1].value-self.lon_padding,
                                None)
      self.lon_prune_slice=tuple(self.lon_prune_slice)
   def call(self, input):
     return input[self.lon_prune_slice]
   def get_config(self):
      return {'index': self.lon_index}
      return {'padding': self.lon_padding}

# Get the autoencoder
model_save_file=("%s/Machine-Learning-experiments/"+
                  "convolutional_autoencoder/"+
                  "saved_models/Epoch_%04d") % (
                     os.getenv('SCRATCH'),50)
autoencoder=tf.keras.models.load_model(model_save_file,
                                       custom_objects={'LonPadLayer': LonPadLayer,
                                                       'LonPruneLayer': LonPruneLayer,
                                                       'ResizeLayer': ResizeLayer})

# Normalisation - Pa to mean=0, sd=1 - and back
def normalise(x):
   x -= 101325
   x /= 3000
   return x

def unnormalise(x):
   x *= 3000
   x += 101325
   return x

fig=Figure(figsize=(9.6,10.8),  # 1/2 HD
           dpi=100,
           facecolor=(0.88,0.88,0.88,1),
           edgecolor=None,
           linewidth=0.0,
           frameon=False,
           subplotpars=None,
           tight_layout=None)
canvas=FigureCanvas(fig)

# Top - map showing original and reconstructed fields
projection=ccrs.RotatedPole(pole_longitude=180.0, pole_latitude=90.0)
ax_map=fig.add_axes([0.01,0.51,0.98,0.48],projection=projection)
ax_map.set_axis_off()
extent=[-180,180,-90,90]
ax_map.set_extent(extent, crs=projection)
matplotlib.rc('image',aspect='auto')

# Run the data through the autoencoder and convert back to iris cube
pm=ic.copy()
pm.data=normalise(pm.data)
ict=tf.convert_to_tensor(pm.data, numpy.float32)
ict=tf.reshape(ict,[1,91,180,1])
result=autoencoder.predict_on_batch(ict)
result=tf.reshape(result,[91,180])
pm.data=unnormalise(result)

# Background, grid and land
ax_map.background_patch.set_facecolor((0.88,0.88,0.88,1))
#mg.background.add_grid(ax_map)
land_img_orig=ax_map.background_img(name='GreyT', resolution='low')

# original pressures as red contours
mg.pressure.plot(ax_map,ic,
                 scale=0.01,
                 resolution=0.25,
                 levels=numpy.arange(870,1050,7),
                 colors='red',
                 label=False,
                 linewidths=1)
# Encoded pressures as blue contours
mg.pressure.plot(ax_map,pm,
                 scale=0.01,
                 resolution=0.25,
                 levels=numpy.arange(870,1050,7),
                 colors='blue',
                 label=False,
                 linewidths=1)

mg.utils.plot_label(ax_map,
                    '%04d-%02d-%02d:%02d' % (2009,3,12,6),
                    facecolor=(0.88,0.88,0.88,0.9),
                    fontsize=8,
                    x_fraction=0.98,
                    y_fraction=0.03,
                    verticalalignment='bottom',
                    horizontalalignment='right')

# Scatterplot of encoded v original
ax=fig.add_axes([0.08,0.05,0.45,0.4])
aspect=.225/.4*16/9
# Axes ranges from data
dmin=min(ic.data.min(),pm.data.min())
dmax=max(ic.data.max(),pm.data.max())
dmean=(dmin+dmax)/2
dmax=dmean+(dmax-dmean)*1.05
dmin=dmean-(dmean-dmin)*1.05
if aspect<1:
    ax.set_xlim(dmin/100,dmax/100)
    ax.set_ylim((dmean-(dmean-dmin)*aspect)/100,
                (dmean+(dmax-dmean)*aspect)/100)
else:
    ax.set_ylim(dmin/100,dmax/100)
    ax.set_xlim((dmean-(dmean-dmin)*aspect)/100,
                (dmean+(dmax-dmean)*aspect)/100)
ax.scatter(x=pm.data.flatten()/100,
           y=ic.data.flatten()/100,
           c='black',
           alpha=0.25,
           marker='.',
           s=2)
ax.set(ylabel='Original',
       xlabel='Encoded')
ax.grid(color='black',
        alpha=0.2,
        linestyle='-',
        linewidth=0.5)


# Plot the training history
history_save_file=("%s/Machine-Learning-experiments/"+
                   "convolutional_autoencoder/"+
                   "saved_models/history_to_%04d.pkl") % (
                      os.getenv('SCRATCH'),50)
history=pickle.load( open( history_save_file, "rb" ) )
ax=fig.add_axes([0.62,0.05,0.35,0.4])
# Axes ranges from data
ax.set_xlim(0,len(history['loss']))
ax.set_ylim(0,numpy.max(numpy.concatenate((history['loss'],
                                           history['val_loss']))))
ax.set(xlabel='Epochs',
       ylabel='Loss (grey) and validation loss (black)')
ax.grid(color='black',
        alpha=0.2,
        linestyle='-',
        linewidth=0.5)
ax.plot(range(len(history['loss'])),
        history['loss'],
        color='grey',
        linestyle='-',
        linewidth=2)
ax.plot(range(len(history['val_loss'])),
        history['val_loss'],
        color='black',
        linestyle='-',
        linewidth=2)


# Render the figure as a png
fig.savefig("comparison_results.png")