Show more stripes
Note
This poster is shamelessly derivative of the Climate Stripes.
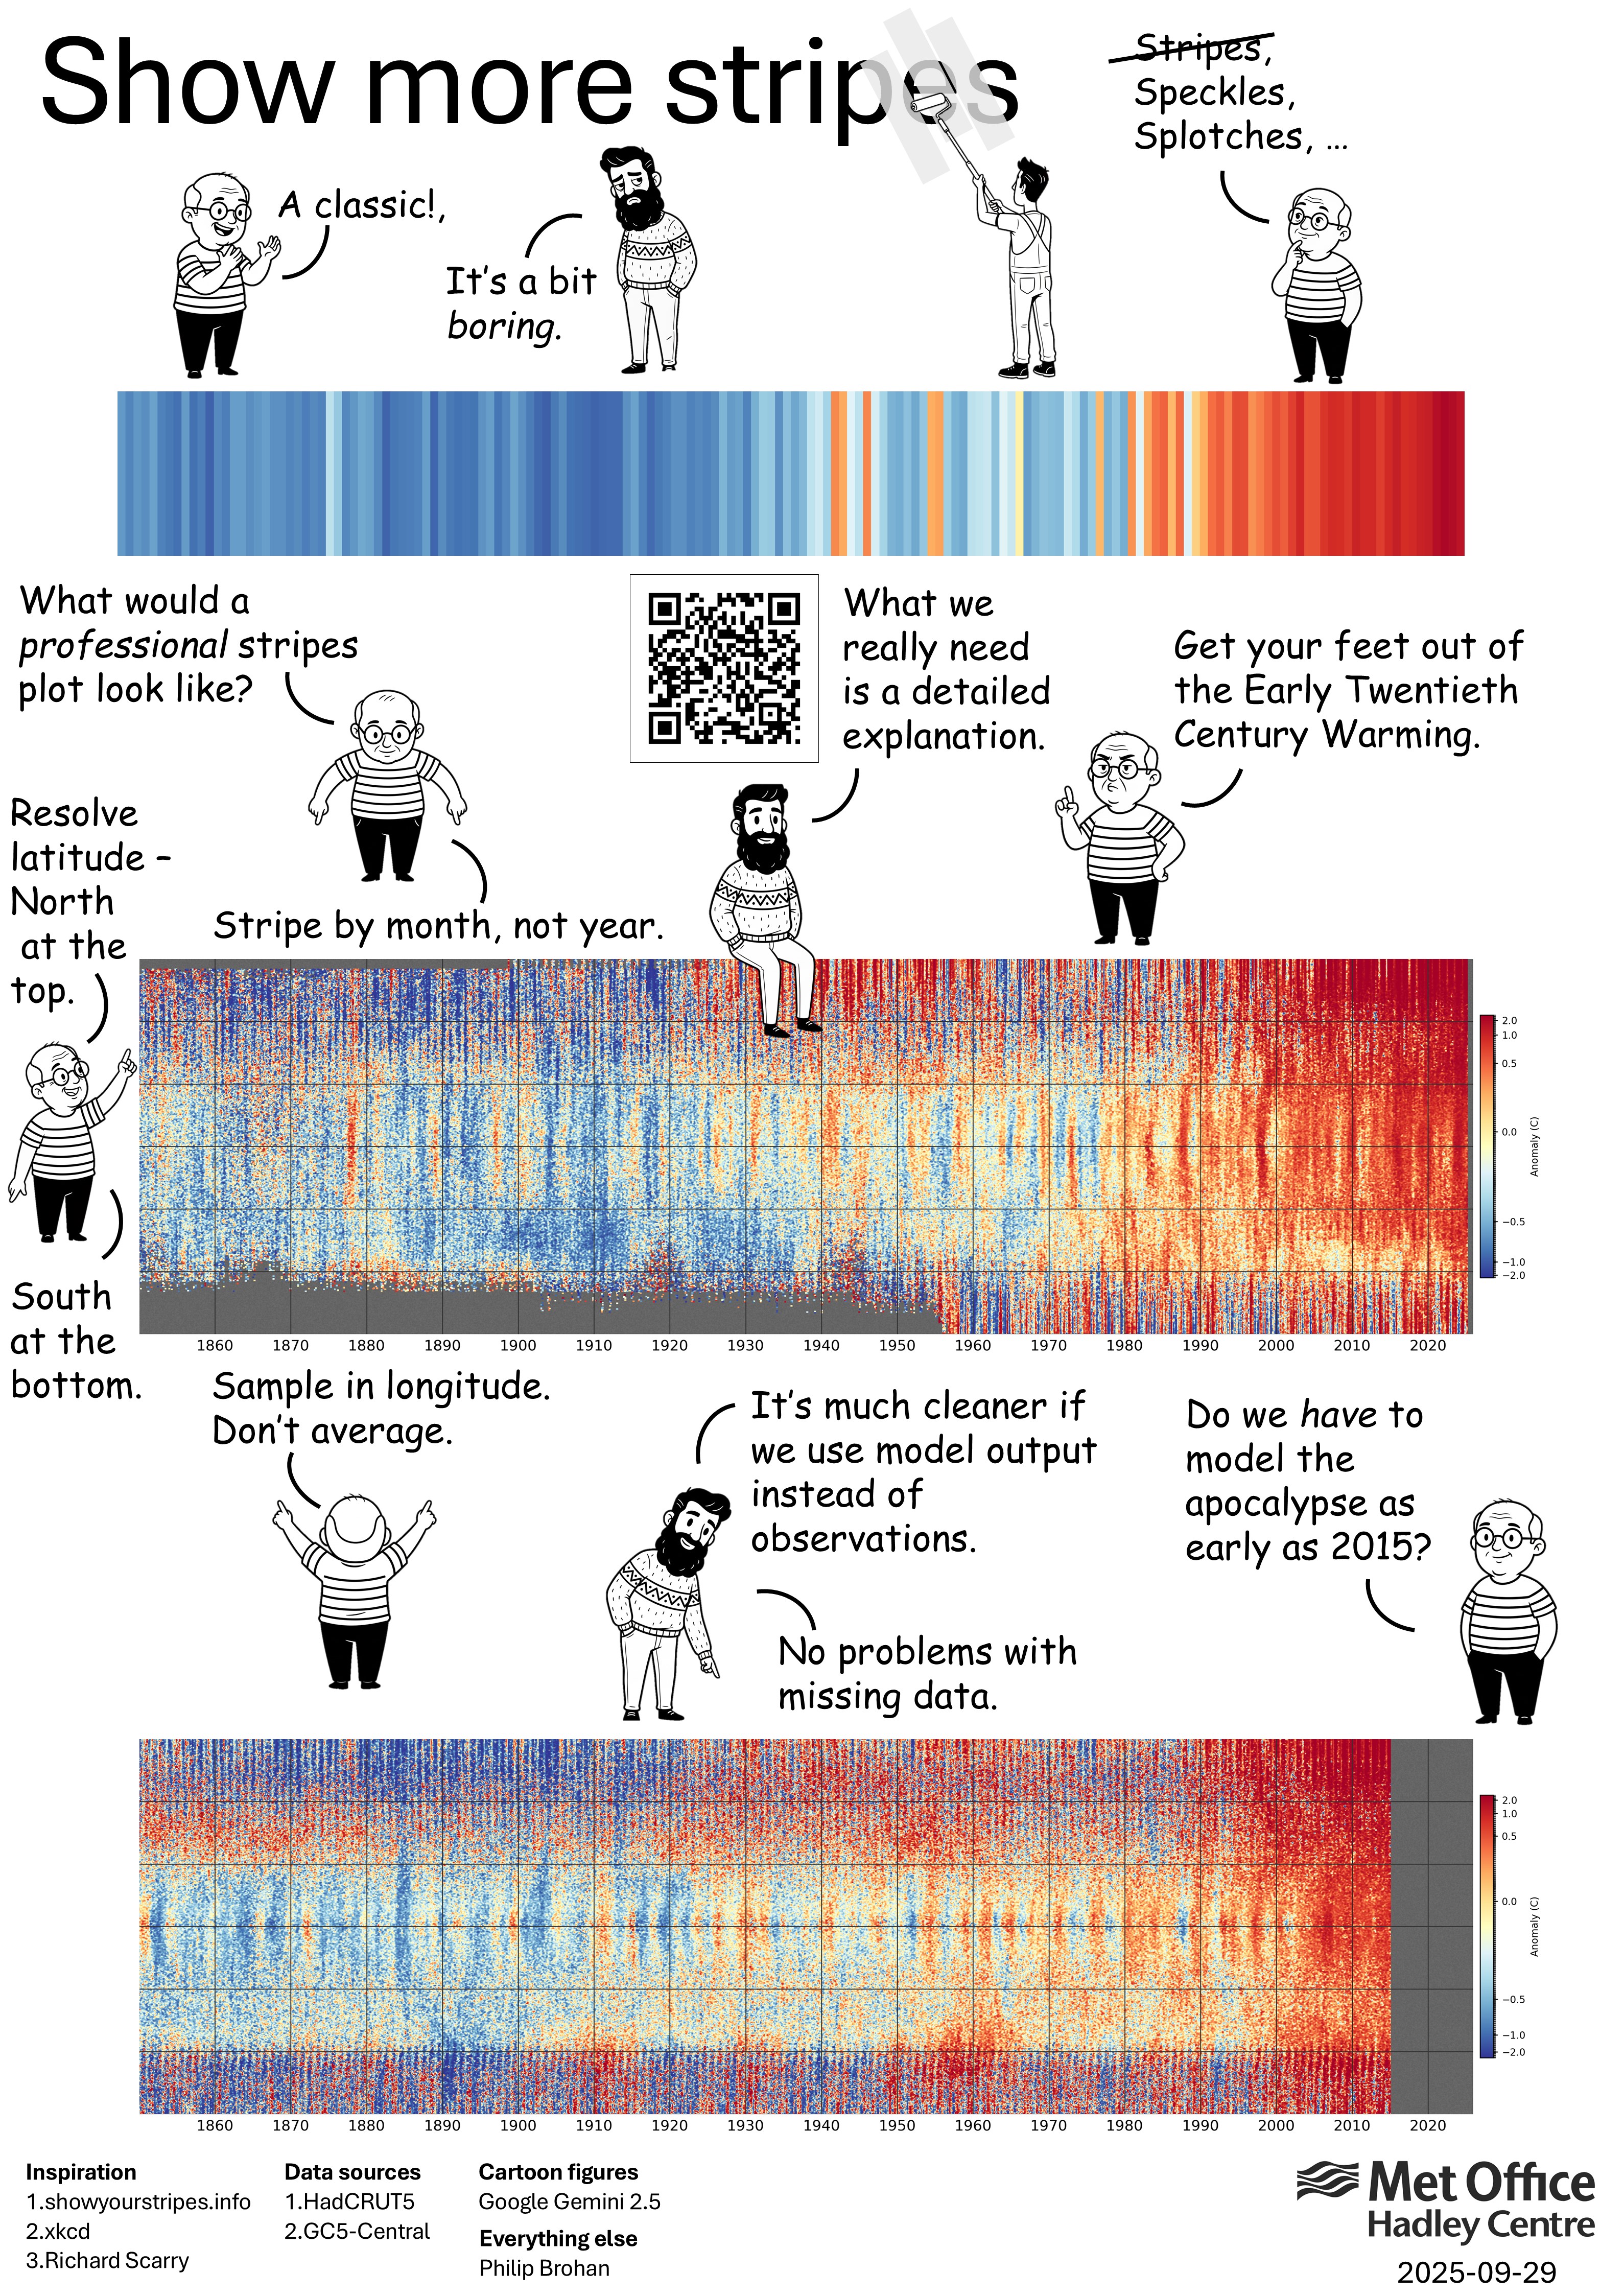
I like the climate stripes (I’m not the only one) but I want to see more details. So this version’s less well suited to painting on the side of a bus, but does give a tremendous amount of information on climate variability and change. It’s also a fast and effective way to demonstrate both the power and limitations of a climate model.
The cartoon images were drawn for me by google Gemini.
Instructions for making the extended strips plots are here and here.
Here’s the final PowerPoint file (14Mb).
This document is licensed under CC BY 4.0. All code included is licensed under the terms of the BSD licence.