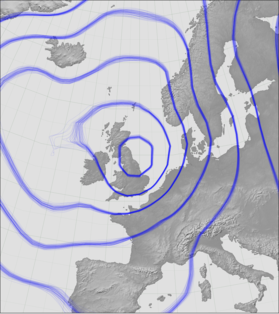
# (C) British Crown Copyright 2017, Met Office
#
# This code is free software: you can redistribute it and/or modify it under
# the terms of the GNU Lesser General Public License as published by the
# Free Software Foundation, either version 3 of the License, or
# (at your option) any later version.
#
# This code is distributed in the hope that it will be useful,
# but WITHOUT ANY WARRANTY; without even the implied warranty of
# MERCHANTABILITY or FITNESS FOR A PARTICULAR PURPOSE.  See the
# GNU Lesser General Public License for more details.
#

import iris
import matplotlib
import numpy

import Meteorographica.utils as utils
from .wind_vectors import *

[docs]def plot_quiver(ax,ue,ve,**kwargs):
    """Plots a pair of variables as a 2d field of arrows.

    This is the same as :meth:`matplotlib.axes.Axes.quiver`, except that it takes :class:`iris.cube.Cube` as arguments instead of a set of vectors, and its defaults are chosen for plots of 10m wind.

    *WARNING* This function is under development - in particular the argument names are badly chosen and will need to be changed.

    Args:
        ax (:obj:`cartopy.mpl.geoaxes.GeoAxes`): Axes on which to draw.
        ue (:obj:`iris.cube.Cube`): meridional value of variable to plot.
        ve (:obj:`iris.cube.Cube`): zonal value of  variable to plot.

    Keyword Args:
        resolution (:obj:`float`): What lat:lon resolution (in degrees) to interpolate [uv]e.data to before plotting. Defaults to 1 degree.
        colors (see :mod:`matplotlib.colors`) vector colour. Defaults to (0,0,0,0.25).
        headwidth (:obj:`float`): Controls arrow shape. Defaults to 1.
        random_state (None|:obj:`int`|:obj:`numpy.random.RandomState`): Random number generation seed, see :func:`sklearn.utils.check_random_state`.
        max_points (:obj:`int`): Maximum number of vectors to allocate, defaults to 100,000.
        zorder (:obj:`float`): Standard matplotlib parameter determining which things are plotted on top (high zorder), and which underneath (low zorder), Defaults to 50.

    Returns:
        See :meth:`matplotlib.axes.Axes.quiver` - also adds the vectors to the plot.

    |
    """

    kwargs.setdefault('points'      ,None)
    kwargs.setdefault('scale'       ,None)
    kwargs.setdefault('resolution'  ,1)
    kwargs.setdefault('color'       ,(0,0,0,0.25))
    kwargs.setdefault('headwidth'   ,1)
    kwargs.setdefault('random_state',None)
    kwargs.setdefault('max_points'  ,100000)
    kwargs.setdefault('zorder'      ,50)

    pole_latitude=ax.projection.proj4_params['o_lat_p']
    pole_longitude=ax.projection.proj4_params['lon_0']-180
    projection_iris=iris.coord_systems.RotatedGeogCS(pole_latitude,
                                                     pole_longitude)
    rw=iris.analysis.cartography.rotate_winds(ue,ve,projection_iris)
    plot_cube=utils.dummy_cube(ax,kwargs.get('resolution'))
    u_p = rw[0].regrid(plot_cube,iris.analysis.Linear())
    v_p = rw[1].regrid(plot_cube,iris.analysis.Linear())
    if kwargs.get('points') is None:
        if kwargs.get('scale') is None: kwargs['scale']=kwargs.get('resolution')
        points=allocate_vector_points(initial_points=None,
                                      lat_range=(min(u_p.coord('latitude').points),
                                                 max(u_p.coord('latitude').points)),
                                      lon_range=(min(u_p.coord('longitude').points),
                                                 max(u_p.coord('longitude').points)),
                                      scale=kwargs.get('scale'),
                                      random_state=kwargs.get('random_state'),
                                      max_points=kwargs.get('max_points'))
    lats = points['Latitude']
    lons = points['Longitude']
    u_interpolator = iris.analysis.Linear().interpolator(u_p,
                                    ['latitude', 'longitude'])
    v_interpolator = iris.analysis.Linear().interpolator(v_p,
                                    ['latitude', 'longitude'])
    u_i=numpy.zeros(lons.size)
    v_i=numpy.zeros(lons.size)
    for i in range(lons.size):
        u_i[i]=u_interpolator([lats[i],lons[i]]).data*-1
        v_i[i]=v_interpolator([lats[i],lons[i]]).data*-1
    qv=ax.quiver(lons,lats,u_i,v_i,
                            headwidth=kwargs.get('headwidth'),
                            color=kwargs.get('color'),
                            scale=2000,
                            zorder=kwargs.get('zorder'))
    return qv


# Plot wind
[docs]def plot(ax,ue,ve,**kwargs):
    """Plot precipitation.

    Generic function for plotting wind. Use the 'type' argument to choose the plot style.

    Args:
        ax (:obj:`cartopy.mpl.geoaxes.GeoAxes`): Axes on which to draw.
        ue (:obj:`iris.cube.Cube`): Zonal wind to plot - must be 2d, with dimensions latitude and longitude.
        ve (:obj:`iris.cube.Cube`): Meridional wind to plot - must be 2d, with dimensions latitude and longitude.


    Kwargs:
        type (:obj:`str`, optional): Style to plot. Default is 'quiver', which delegates plotting to :meth:`plot_quiver` and at the moment this is the only choice.
        Other keyword arguments are passed to the style-specific plotting function.

    |
    """

    kwargs.setdefault('type','quiver')

    if kwargs.get('type')=='quiver':
        return plot_quiver(ax,ue,ve,**kwargs)

    raise Exception('Unsupported wind plot type %s' %
                         kwargs.get('type'))
