Meteorographica.pressure
This module is designed to make plots of mean-sea-level-pressure (mslp), but they are basically just contour plots, so the functions can be used for any (continuous) scalar variable (with appropriate specification of levels).
It takes a cartopy.mpl.geoaxes.GeoAxes to draw into, and an iris.cube.Cube (with ‘latitude’ and ‘longitude’ dimensions) of data to plot. Then it’s just:
Meteorographica.pressure.plot(geoaxes,cube,**options)
Three different types of plot are supported:
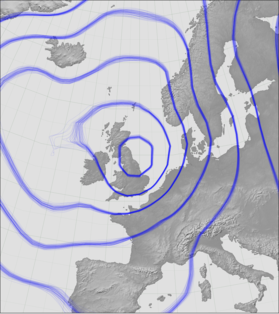
- ‘contour’ - straight contour plot of a single pressure field.
- ‘spaghetti’ - spaghetti-contour plot of multiple pressure fields.
- ‘spread’ - mean-contour plot with error bars derived from an ensemble of pressure fields.
See examples of use.
-
Meteorographica.pressure.make_label_hints(ax, CS)[source]¶ Make hints for the contour label placement algorithm - these stabilise the positions of the contour labels between frames in videos. They don’t eliminate the problem of jittery and flickering contour labels, but they do help.
Parameters: - ax (
cartopy.mpl.geoaxes.GeoAxes) – Axes on which to draw. - CS (
matplotlib.contour.ContourSet) – Contours to be labeled.
Returns: iterable of (x,y) tuples - each a position hint for a label.
- ax (
-
Meteorographica.pressure.plot(ax, pe, **kwargs)[source]¶ Plot pressure.
Generic function for plotting pressure. Use the ‘type’ argument to choose the plot style.
Parameters: - ax (
cartopy.mpl.geoaxes.GeoAxes) – Axes on which to draw. - pe (
iris.cube.Cube) – Variable to plot - must have dimensions ‘latitude’ and ‘longitude’.
Keyword Arguments: type (
str) – Style to plot. Options are:’contour’ (default), which delegates plotting toplot_contour(), ‘spaghetti’, which delegates plotting toplot_spaghetti_contour(), ‘spread’, which delegates plotting toplot_mean_spread().Other keyword arguments are passed to the style-specific plotting function.
Returns: See matplotlib.axes.Axes.contour()- Also adds the lines to the plot.- ax (
-
Meteorographica.pressure.plot_contour(ax, pe, **kwargs)[source]¶ Plots a variable as a contour plot.
This is the same as
matplotlib.axes.Axes.contour(), except that it takes aniris.cube.Cubeinstead of an array of values, and its defaults are chosen for plots of mean-sea-level pressure.Parameters: - ax (
cartopy.mpl.geoaxes.GeoAxes) – Axes on which to draw. - pe (
iris.cube.Cube) – Variable to plot - must have dimensions ‘latitude’ and ‘longitude’.
Keyword Arguments: - label (
bool) – Label contour lines? Defaults to False. If it’s ‘video’ use stablised label locations. - resolution (
float) – What lat:lon resolution (in degrees) to interpolate pe.data to before plotting. Defaults to None - use original resolution. - scale (
float) – This function is tuned for data in hPa. For data in Pa, set this to 0.01. Defaults to 1. - colors (see
matplotlib.colors) – - linewidths (
float) – Line width for contour lines. Defaults to 0.5. - alpha (
float) – Colour alpha blend. Defaults to 1 (opaque). - fontsize (
int) – Font size for contour labels. Defaults to 12. - zorder (
float) – Standard matplotlib parameter determining which things are plotted on top (high zorder), and which underneath (low zorder), Defaults to 30.
Returns: See
matplotlib.axes.Axes.contour()- also adds the lines to the plot.- ax (
-
Meteorographica.pressure.plot_mean_spread(ax, pe, **kwargs)[source]¶ Plots a variable as a contour plot.
Plots contours of the mean of an ensemble, mark uncertainty by fading out the contours where the ensemble spread is large.
Parameters: - ax (
cartopy.mpl.geoaxes.GeoAxes) – Axes on which to draw. - pe (
iris.cube.Cube) – Variable to plot.- must have dimensions <ensemble_dimension>, ‘latitude’ and ‘longitude’.
Keyword Arguments: - ensemble_dimension (
float) – name of the ensemble dimension. Defaults to ‘member’. - resolution (
float) – What lat:lon resolution (in degrees) to interpolate pe.data to before plotting. Defaults to None - use original resolution. - colors (see
matplotlib.colors) – - linewidths (
float) – Line width for contour lines. Defaults to 0.2. - label (
bool) – Label contour lines? Defaults to False. - cmap (
matplotlib.colors.LinearSegmentedColormap) – Mapping of pe.data to plot colour. Defaults to blackblack semi-transparent. - threshold (
float) – Ranges shown are regions where the probability that a contour line passes through the region is greater than this. Defaults to 0.05 (5%). - vmax (
float) – Show as ‘most likely’, regions where the prob of a contour is greater than this Defaults to 0.4 (40%). - line_threshold (
float) – Only draw contours where the local standard deviation is less than this. Defaults to None - draw contours everywhere. - alpha (
float) – Colour alpha blend. Defaults to 1 (opaque). - fontsize (
int) – Font size for contour labels. Defaults to 12. - zorder (
float) – Standard matplotlib parameter determining which things are plotted on top (high zorder), and which underneath (low zorder), Defaults to 40. - label – Label contour lines? Defaults to True.
Returns: See
matplotlib.axes.Axes.contour()- also adds the lines to the plot.- ax (
-
Meteorographica.pressure.plot_spaghetti_contour(ax, pe, **kwargs)[source]¶ Plots a multi-contour (spaghetti) plot.
Calls
plot_pressure_contour()multiple times with sensible defaults colurs and stylesParameters: - ax (
cartopy.mpl.geoaxes.GeoAxes) – Axes on which to draw. - pe (
iris.cube.Cube) – Variable to plot.- must have dimensions <ensemble_dimension>, ‘latitude’ and ‘longitude’.
Keyword Arguments: - ensemble_dimension (
float) – name of the ensemble dimension. Defaults to ‘member’. - colors (see
matplotlib.colors) – - linewidths (
float) – Line width for contour lines. Defaults to 0.2. - label (
bool) – Label contour lines? Defaults to False.
:keyword Other keyword arguments are passed to
plot_pressure_contour():Returns: See matplotlib.axes.Axes.contour()- except it’s an array, one for each member. Also adds the lines to the plot.- ax (