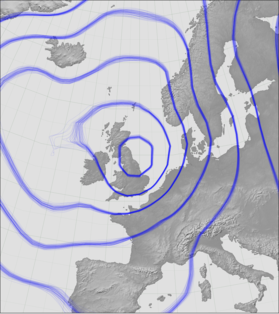
Meteorographica.wind
This module is designed to make plots of 10-metre wind, the functions can be used for any 2-element vector variable (with appropriate scaling factors).
It takes a cartopy.mpl.geoaxes.GeoAxes to draw into, and two iris iris.cube.Cube (each with ‘latitude’ and ‘longitude’ dimensions) as the zonal and meridional components to plot. Then it’s just:
Meteorographica.wind.plot(geoaxes,zonal_cube,meridional_cube,**options)
See examples of use.
-
Meteorographica.wind.allocate_vector_points(initial_points=None, lat_range=(-90, 90), lon_range=(-180, 180), scale=5.0, random_state=None, max_points=10000)[source]¶ Allocate even coverage of points over a 2d space - for wind vectors.
WARNING This function is broken/unfinished - do not use.
To plot wind vectors in a video, we need an even coverage that moves with the wind. So we need a function that will take a set of wind-vector locations and keep their coverage fairly even, by removing any that have got too close together, and seeding new ones to fill any holes in the coverage.
Parameters: - points (initial) – None (default) or the output from a previous run of this function (see return value).
- lat_range (
list, optional) – The latitude range to cover with points. Defaults to (-90,90). - lon_range (
list, optional) – The longitude range to cover with points. Defaults to (-180,180). - scale (
float) – Characteristic separation between points (in degrees). - random_state (None|:obj:int`|:obj:`numpy.random.RandomState) – Random number generation seed, see
sklearn.utils.check_random_state(). - max_points (
int, optional) – Maximum number of points to allocate, defaults to 10,000.
Returns: Dictionary with components ‘Longitude’, ‘Latitude’, (both arrays of float) and ‘Age’ (array of int). The first two give the positions of each point, and ther last counts how many times each point has been updated by this function.
Return type: Raises: StandardError– if max_points is too small - more points than this are needed to cover the region.
-
Meteorographica.wind.plot(ax, ue, ve, **kwargs)[source]¶ Plot precipitation.
Generic function for plotting wind. Use the ‘type’ argument to choose the plot style.
Parameters: - ax (
cartopy.mpl.geoaxes.GeoAxes) – Axes on which to draw. - ue (
iris.cube.Cube) – Zonal wind to plot - must be 2d, with dimensions latitude and longitude. - ve (
iris.cube.Cube) – Meridional wind to plot - must be 2d, with dimensions latitude and longitude.
- Kwargs:
- type (
str, optional): Style to plot. Default is ‘quiver’, which delegates plotting toplot_quiver()and at the moment this is the only choice. Other keyword arguments are passed to the style-specific plotting function.
- ax (
-
Meteorographica.wind.plot_quiver(ax, ue, ve, **kwargs)[source]¶ Plots a pair of variables as a 2d field of arrows.
This is the same as
matplotlib.axes.Axes.quiver(), except that it takesiris.cube.Cubeas arguments instead of a set of vectors, and its defaults are chosen for plots of 10m wind.WARNING This function is under development - in particular the argument names are badly chosen and will need to be changed.
Parameters: - ax (
cartopy.mpl.geoaxes.GeoAxes) – Axes on which to draw. - ue (
iris.cube.Cube) – meridional value of variable to plot. - ve (
iris.cube.Cube) – zonal value of variable to plot.
Keyword Arguments: - resolution (
float) – What lat:lon resolution (in degrees) to interpolate [uv]e.data to before plotting. Defaults to 1 degree. - colors (see
matplotlib.colors) vector colour. Defaults to (0,0,0,0.25) – - headwidth (
float) – Controls arrow shape. Defaults to 1. - random_state (None|:obj:int`|:obj:`numpy.random.RandomState) – Random number generation seed, see
sklearn.utils.check_random_state(). - max_points (
int) – Maximum number of vectors to allocate, defaults to 100,000. - zorder (
float) – Standard matplotlib parameter determining which things are plotted on top (high zorder), and which underneath (low zorder), Defaults to 50.
Returns: See
matplotlib.axes.Axes.quiver()- also adds the vectors to the plot.- ax (
