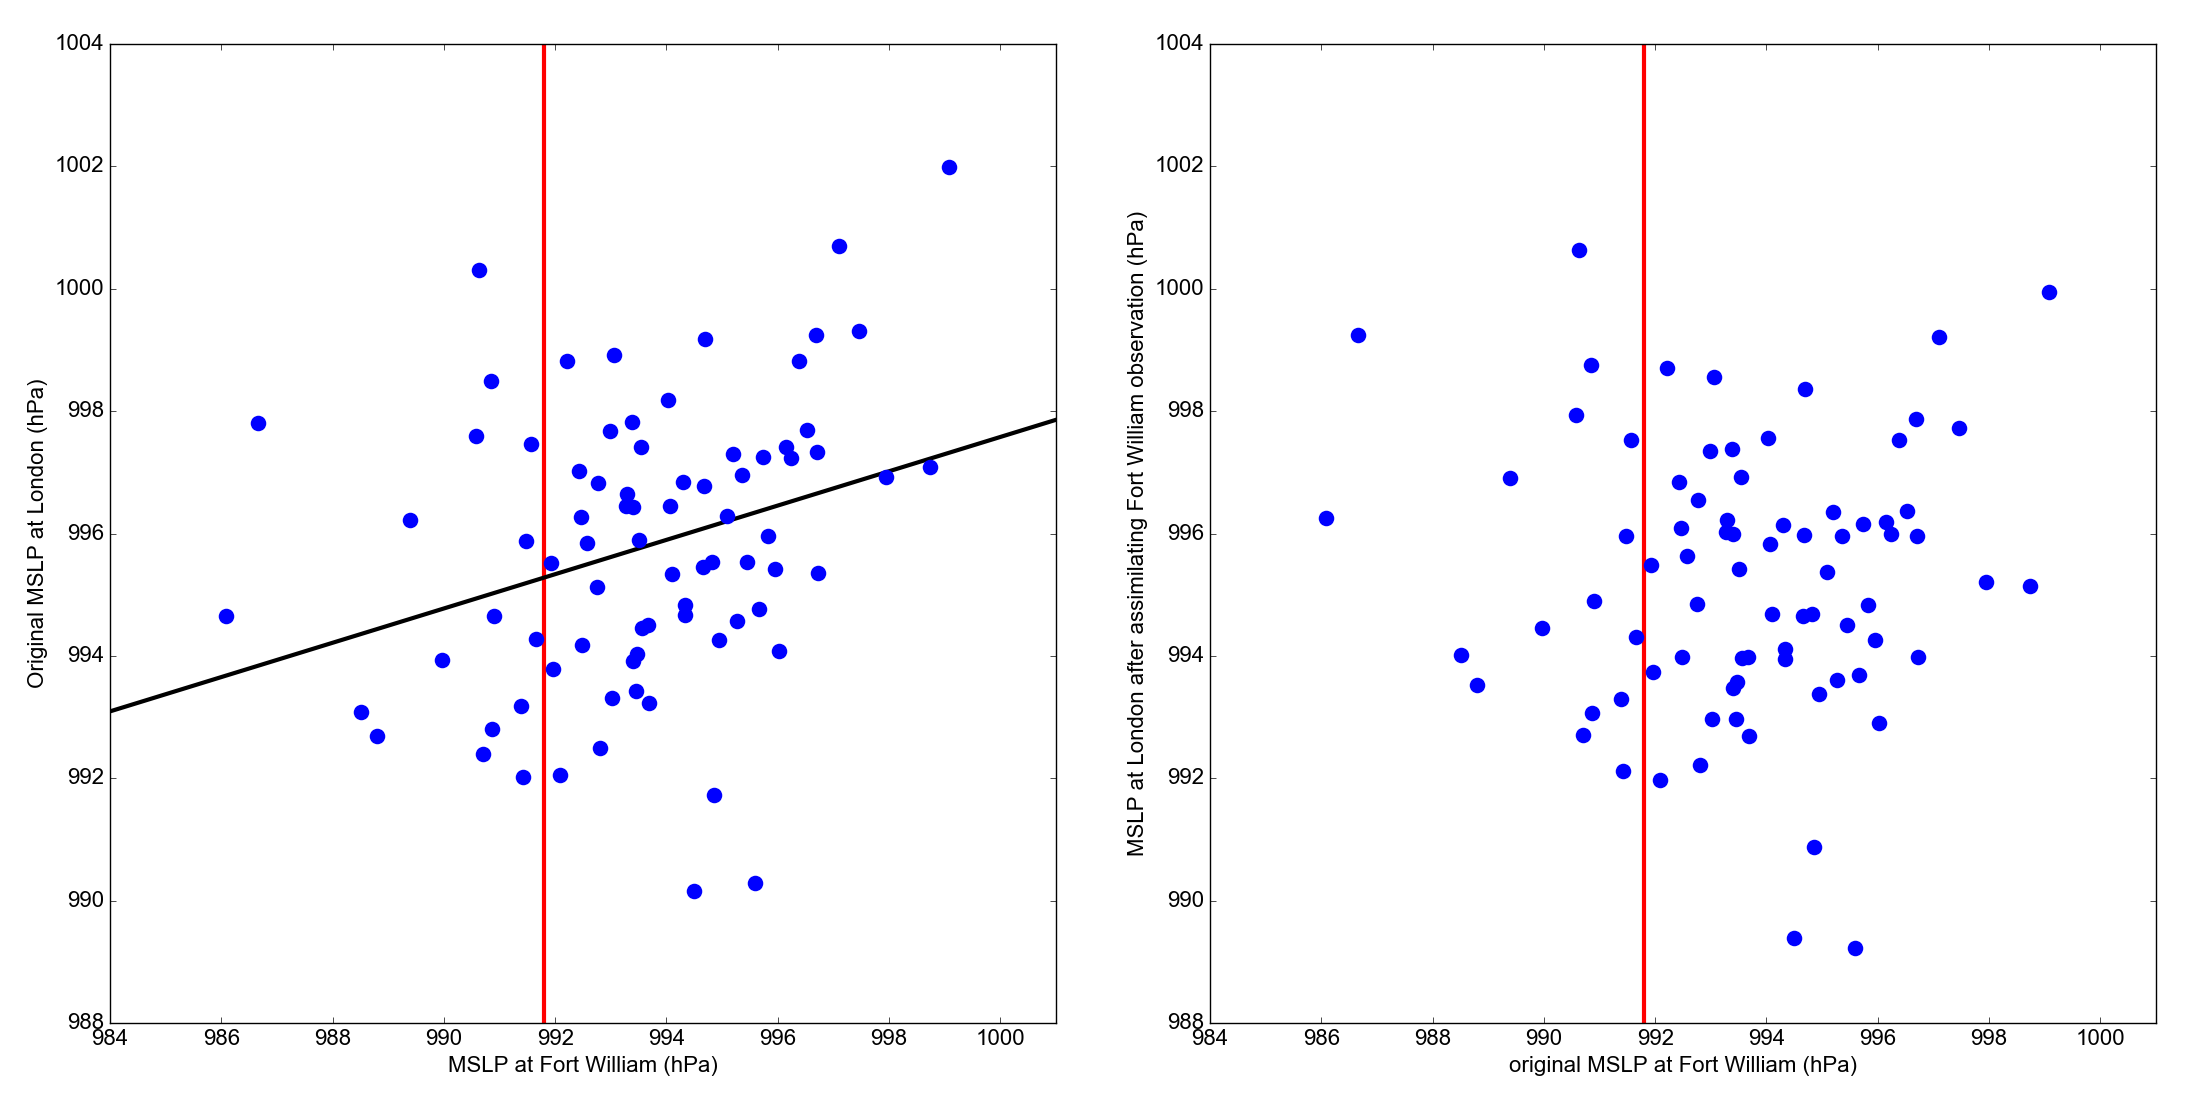
Effect at London of assimilating observation at Fort William

MSLP at London, before and after assimilating the Fort William observation.
Scatter plots of 20CRv3 ensemble pressures at London against ensemble pressures at Fort William, at 6pm on 22nd October 1903. The London pressures are adjusted by fitting a linear regression (left plot) and then removing the fit from each value (right plot).
Code to make the figure
Collect the data (prmsl ensemble and observations from 20CR2c for 1903):
#!/usr/bin/env python

import IRData.twcr as twcr
import datetime
dte=datetime.datetime(1903,10,22)
twcr.fetch('prmsl',dte,version='4.5.1')
twcr.fetch_observations(dte,version='4.5.1')
Script to make the figure:
#!/usr/bin/env python

# UK region weather plot
# Relationship between Fort William and London

import math
import datetime
import numpy
import collections

import iris
import iris.analysis

import matplotlib
from matplotlib.backends.backend_agg import \
                 FigureCanvasAgg as FigureCanvas
from matplotlib.figure import Figure
from matplotlib.patches import Circle

import IRData.twcr as twcr

import DWR
import DIYA

import sklearn.linear_model

# Date to show
year=1903
month=10
day=22
hour=18
dte=datetime.datetime(year,month,day,hour)

# Landscape page
fig=Figure(figsize=(22,11),  # Width, Height (inches)
           dpi=100,
           facecolor=(0.88,0.88,0.88,1),
           edgecolor=None,
           linewidth=0.0,
           frameon=False,
           subplotpars=None,
           tight_layout=None)
canvas=FigureCanvas(fig)
font = {'family' : 'sans-serif',
        'sans-serif' : 'Arial',
        'weight' : 'normal',
        'size'   : 16}
matplotlib.rc('font', **font)

# Get the DWR observations within +- 2 hours
obs=DWR.load_observations('prmsl',
                          dte-datetime.timedelta(hours=2),
                          dte+datetime.timedelta(hours=2))
# Discard everthing except Fort William
obs=obs[obs.name=='FORTWILLIAM']

# load the pressures
prmsl=twcr.load('prmsl',dte,version='4.5.1')

# Compare with London
target_lat= 51.51
target_lon= -0.13

# Before scatter plot

ax_scp=fig.add_axes([0.05,0.07,0.43,0.89])

# pressure range
extent=[984,1001]
extent_london=[988,1004]

# x-axis
ax_scp.set_xlim(extent)
ax_scp.set_xlabel('MSLP at Fort William (hPa)')
# y-axis
ax_scp.set_ylim(extent_london)
ax_scp.set_ylabel('Original MSLP at London (hPa)')

# Ensemble values at Fort William
interpolator = iris.analysis.Linear().interpolator(prmsl,
                                   ['latitude', 'longitude'])
latlon=DWR.get_station_location(obs,'FORTWILLIAM')
ens_FW=interpolator([latlon['latitude'],
                     latlon['longitude']])
# And at Stornoway
ens_ST=interpolator([numpy.array(target_lat),
                     numpy.array(target_lon)])

ax_scp.scatter(ens_FW.data/100,ens_ST.data/100,
            500, # Point size
            'blue', # Color
            marker='.',
            edgecolors='face',
            linewidths=0.0,
            alpha=1,
            zorder=5)

# Plot the observed FW value
fwi=DWR.at_station_and_time(obs,'FORTWILLIAM',dte)
ax_scp.plot((fwi,fwi),extent_london,color='red',lw=3)

# Fit a linear model
model=sklearn.linear_model.LinearRegression()
model.fit(ens_FW.data.reshape(-1,1),ens_ST.data)
pre=model.predict(numpy.array((extent[0]*100,extent[1]*100)).reshape(-1,1))
ax_scp.plot(extent,pre/100,color='black',lw=3)

ax_scp2=fig.add_axes([0.55,0.07,0.43,0.89])

# x-axis
ax_scp2.set_xlim(extent)
ax_scp2.set_xlabel('original MSLP at Fort William (hPa)')
# y-axis
ax_scp2.set_ylim(extent_london)
ax_scp2.set_ylabel('MSLP at London after assimilating Fort William observation (hPa)')

# Adjust the mslp by assimilating the FW ob
ST_adjusted=DIYA.constrain_point(ens_ST.data,ens_FW.data.reshape(-1,1),
                                   model=model,obs=fwi*100)

ax_scp2.plot((fwi,fwi),extent_london,color='red',lw=3)
ax_scp2.scatter(ens_FW.data/100,ST_adjusted/100,
            500, # Point size
            'blue', # Color
            marker='.',
            edgecolors='face',
            linewidths=0.0,
            alpha=1,
            zorder=5)

# Output as png
fig.savefig('before+after_london_%04d%02d%02d%02d.png' %
                                    (year,month,day,hour))
