Representing uncertainty in weather maps
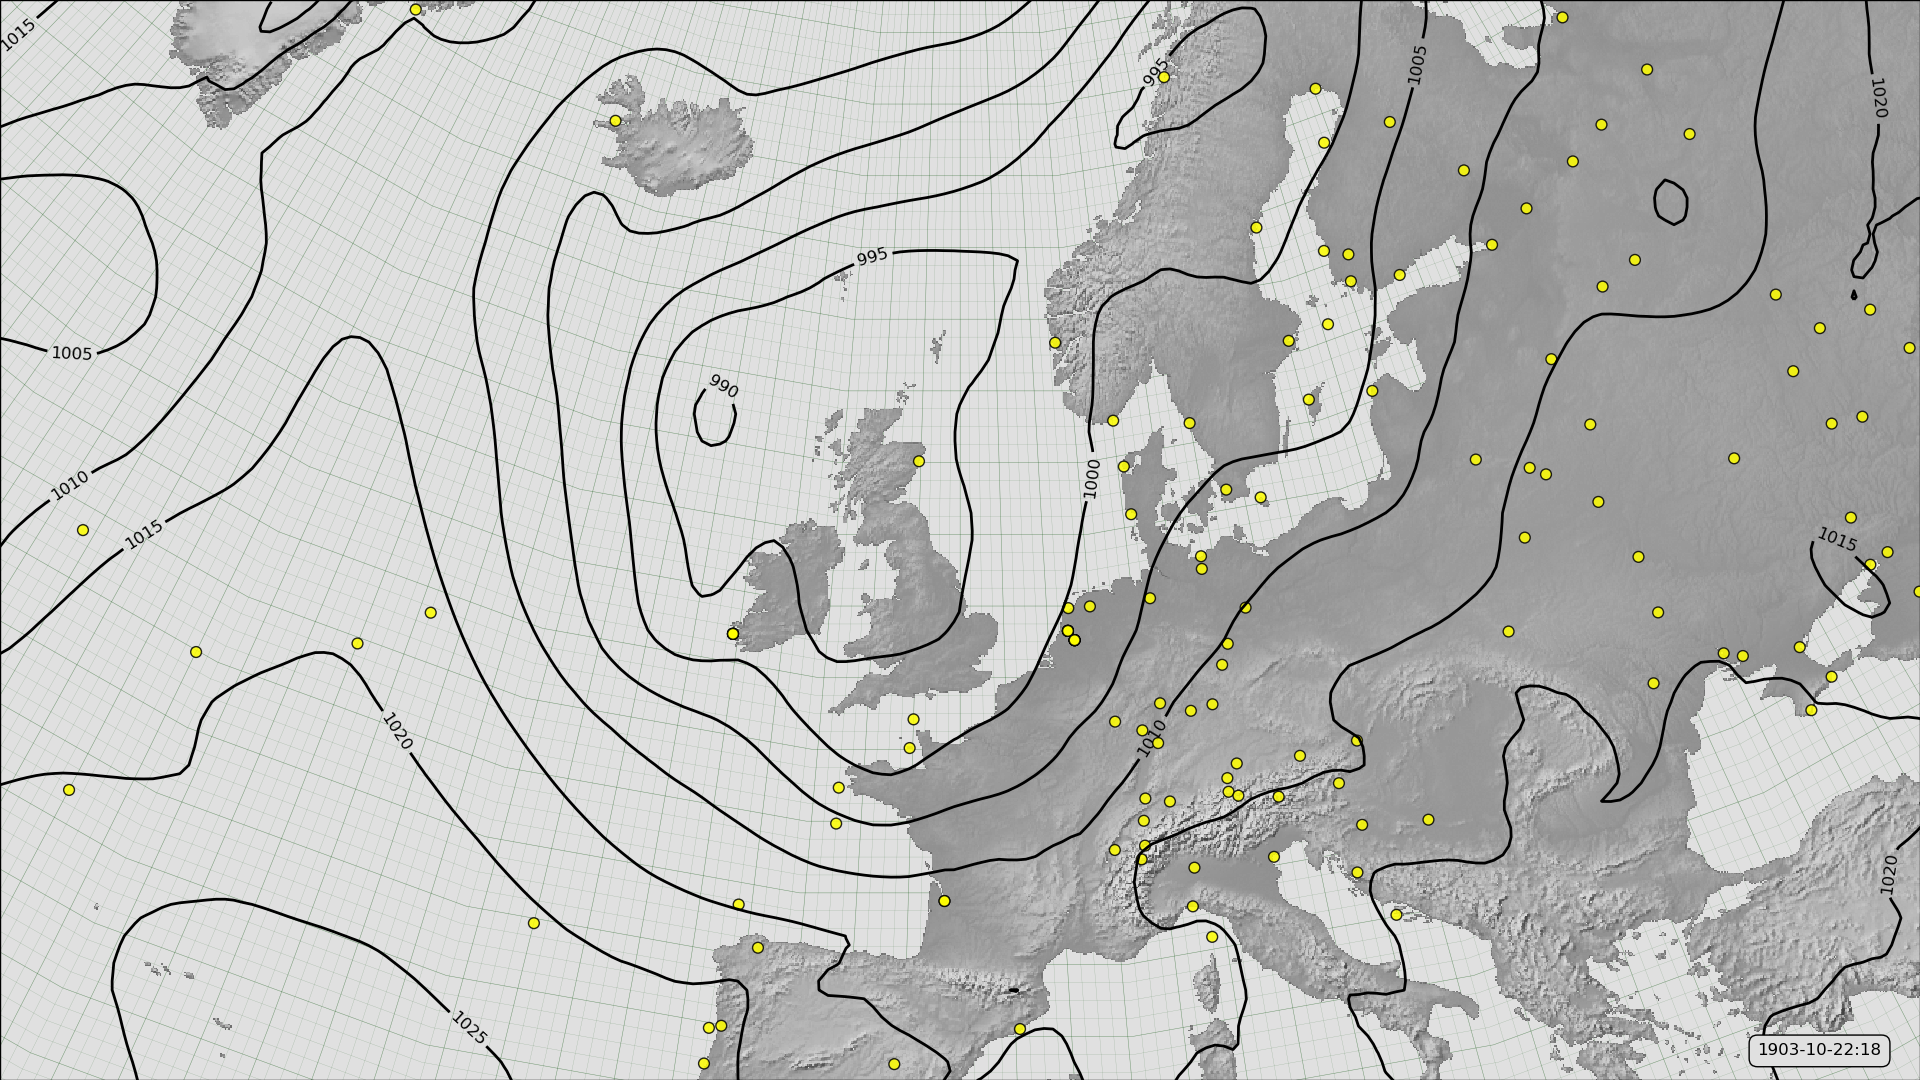
A traditional weather map shows the surface pressure field, and possibly symbols for highs and lows, fronts and featues, and sometimes observations. The long reanalyses, such as 20CR let us make weather maps for any period in the past 100+ years:

MSLP contours from the first ensemble member of 20CRv3 for October 22nd, 1903 (at 6pm), and observations assimilated. (Figure source).
This map is a representation of the weather at this point in time, but it is not exactly correct, it is uncertain. And for times and places where there are few observations to constrain the reanalysis, the uncertainty is large.
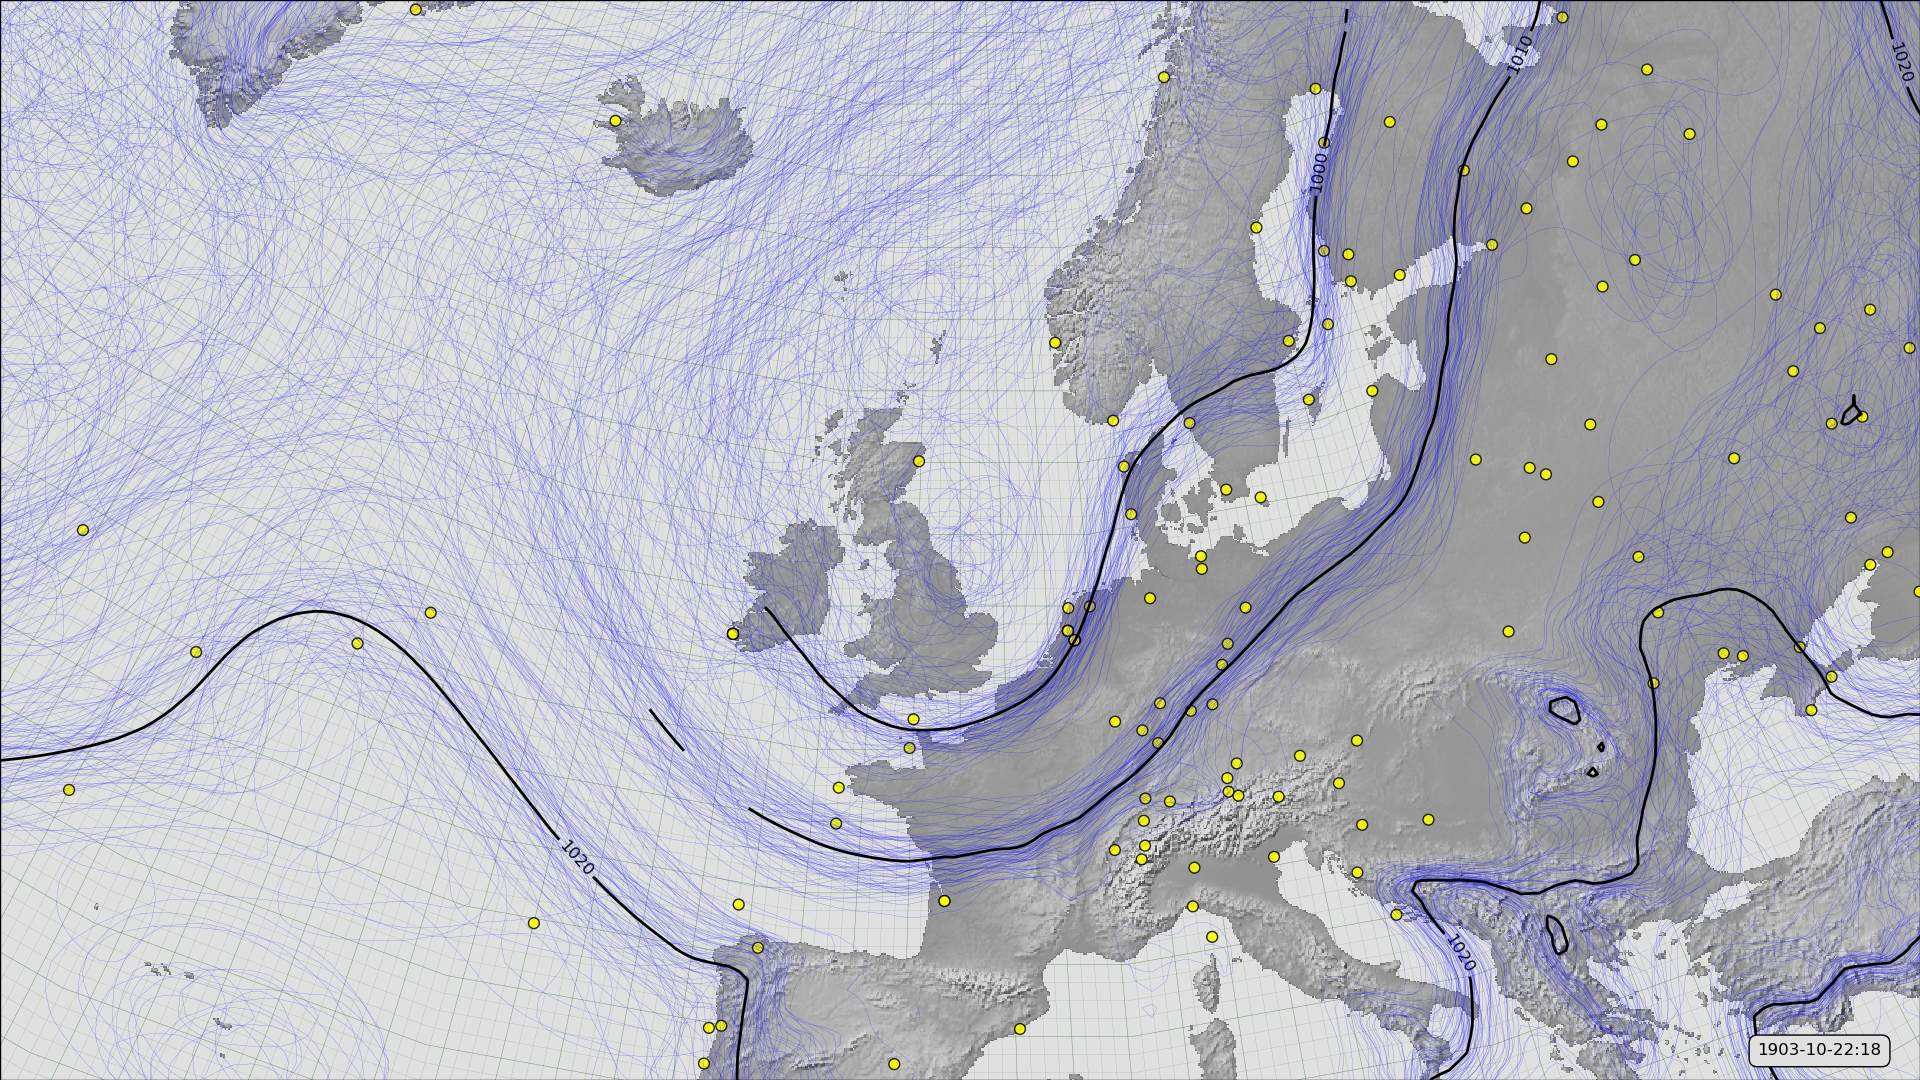
Because 20CR is an ensemble product it contains information about the uncertainty in the spread of its ensemble. So we can make a map that shows both the best-estimate MSLP, and the uncertainty in that estimate:

A spaghetti plot, of MSLP contours from 20CRv3 for October 22nd, 1903 (at 6pm), and observations assimilated (yellow dots). The blue lines are contours of MSLP for each of the 80 ensemble menbers in 20CRv3. Where the uncertainty is low these will cluster together (around the corresponding black contour) - where the blue contours diverge the uncertainty in the field is large. (Figure source).
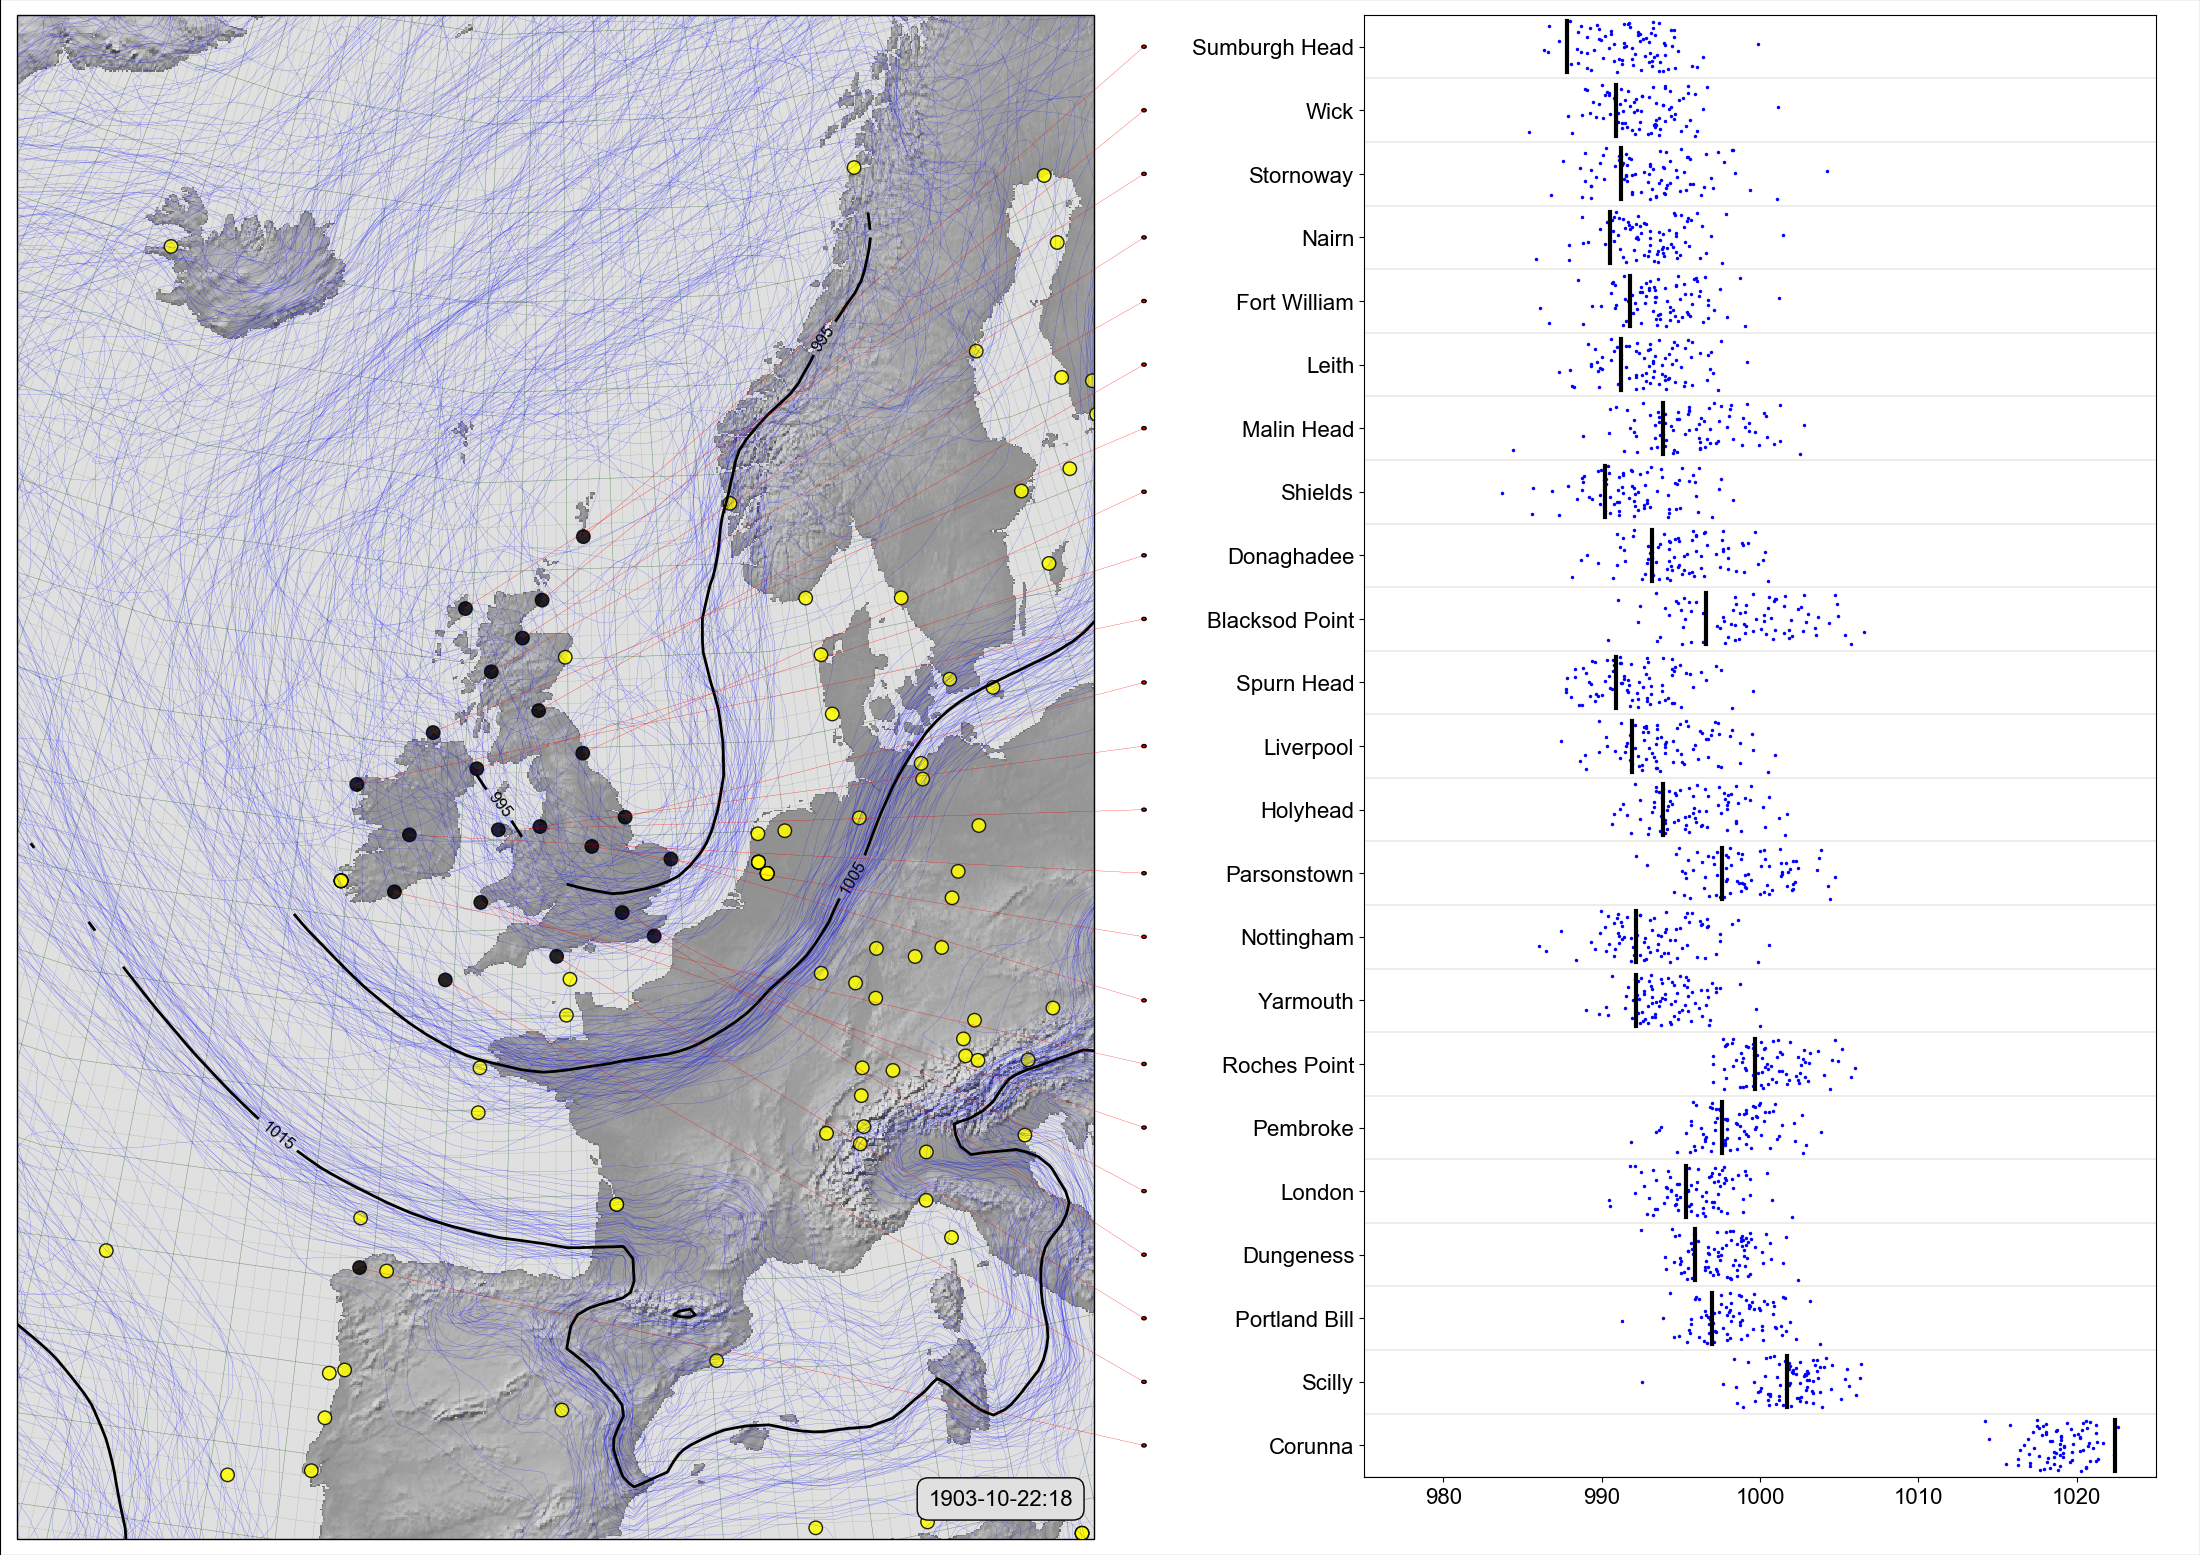
A recent digitisation project has provided new observations - not assimilated by 20CR - which we can use to validate the reanalysis:

On the left, a spaghetti-contour plot as above, of 20CRv3 MSLP for October 22nd, 1903 (at 6pm). On the right, comparison of the ensemble values (blue dots), with independent observations from the Daily Weather Reports (black lines). (Figure source).
The observations are within the spread of the reanalysis, so the reanalysis at this time and place is accurate - but it isn’t very precise, the spread is substantial at the locations of the observations. We would like to use the observations to improve the reanalysis - to make a revised version with the same accuracy, but increased precision.
