#!/usr/bin/env python

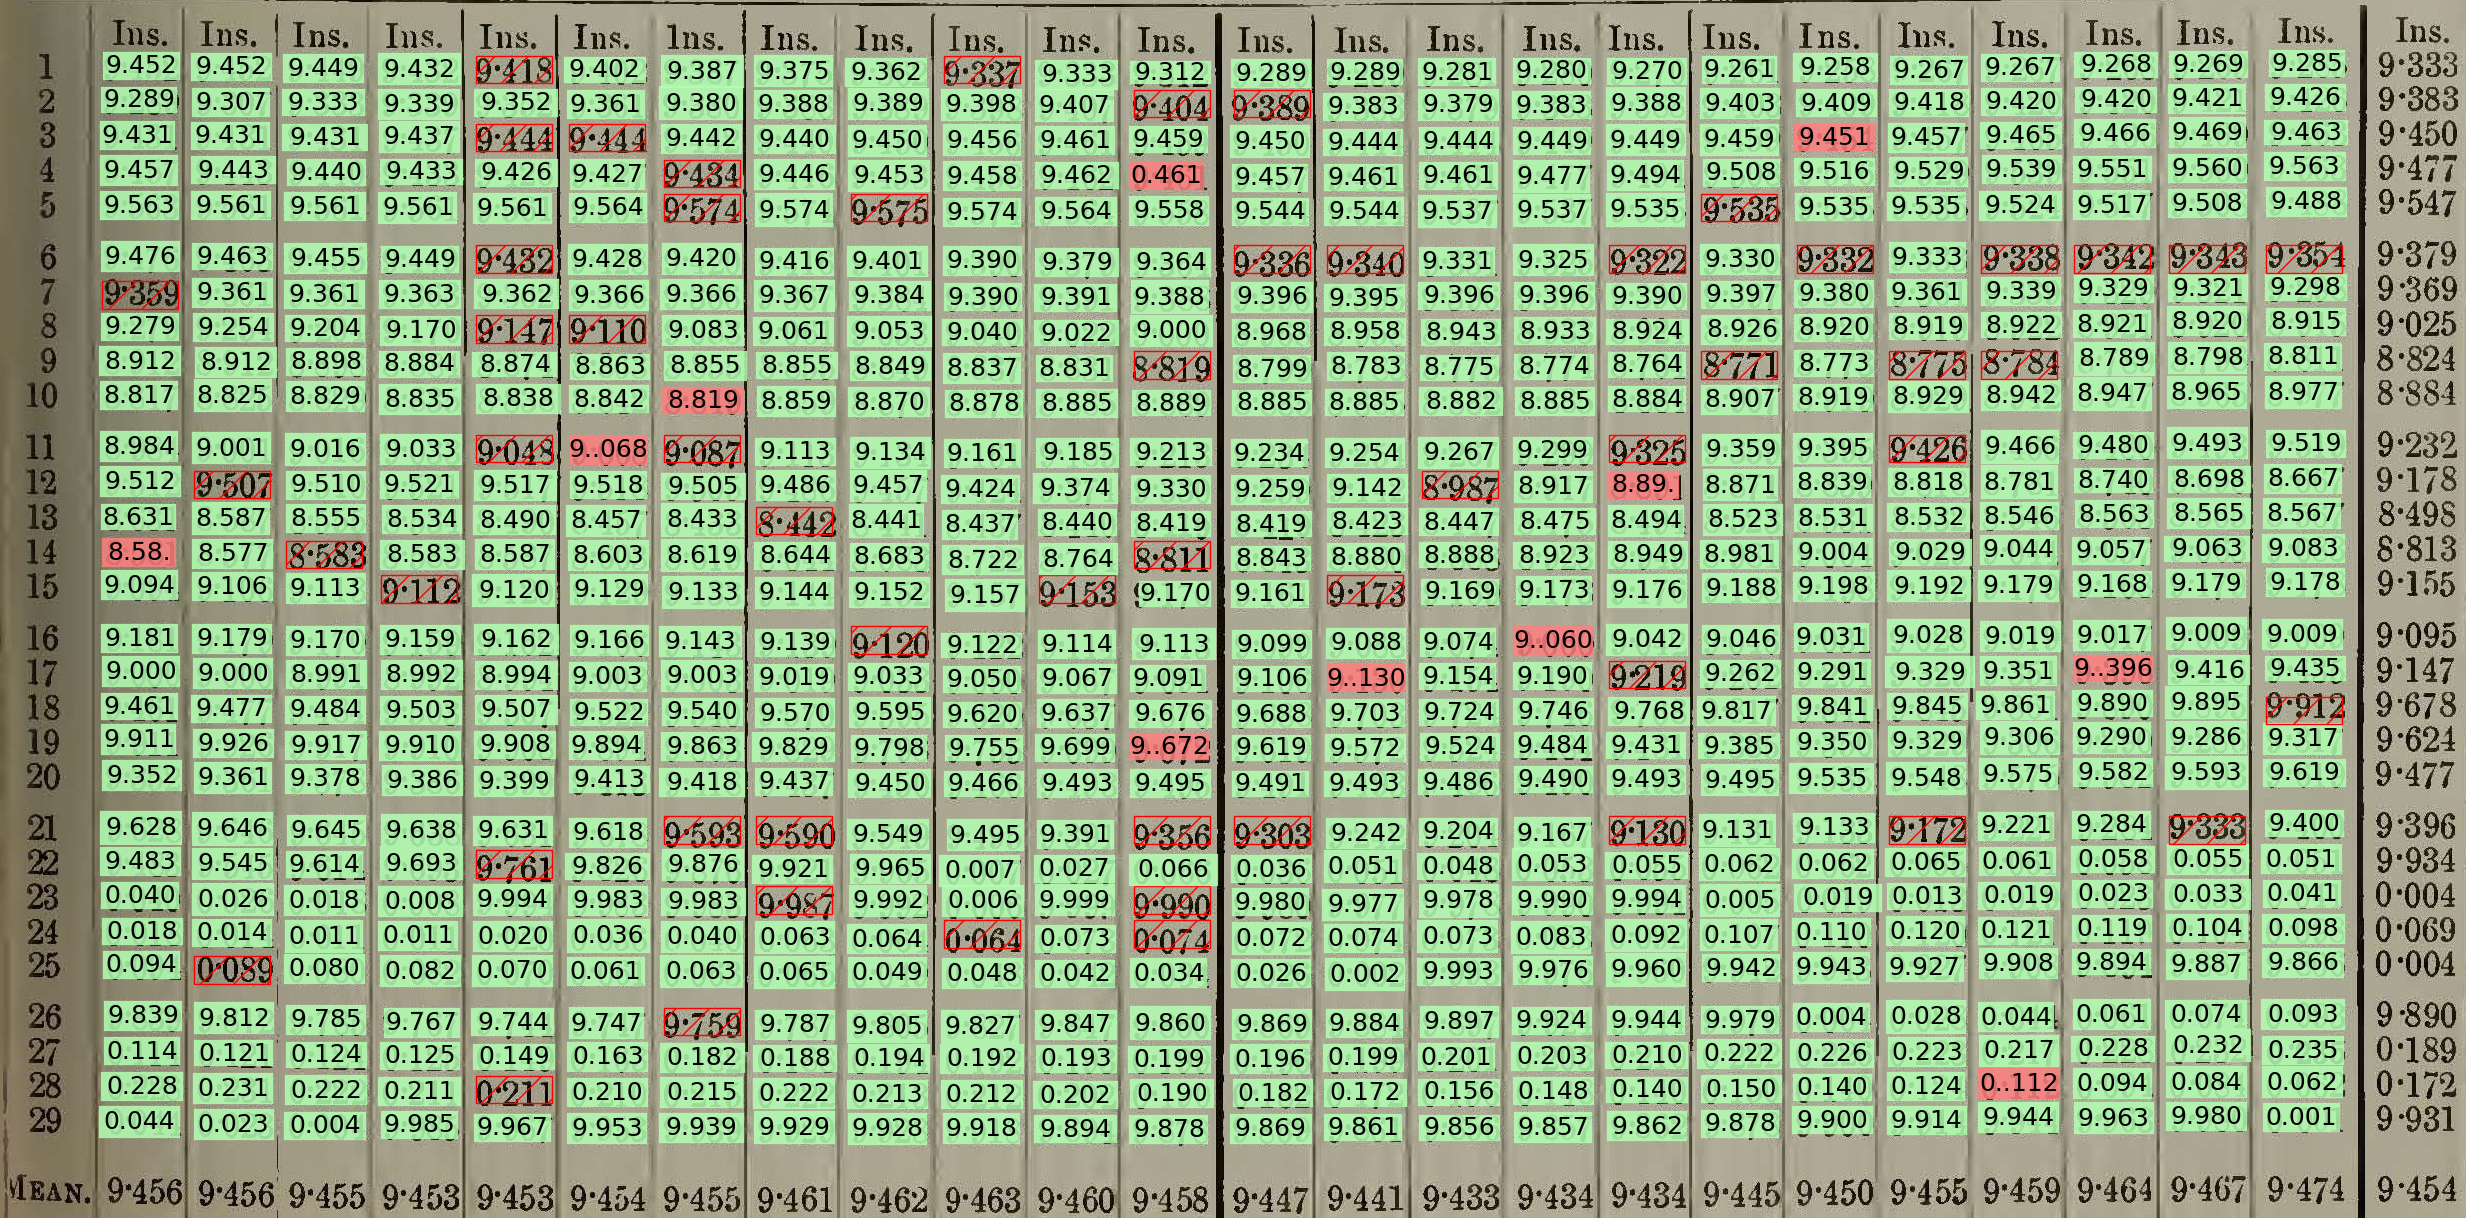
# Overplot transcription results on the original image.
# Show successful, erronious, and missing results.

import argparse
import pickle
from PIL import Image

import matplotlib
from matplotlib.backends.backend_agg import \
             FigureCanvasAgg as FigureCanvas
from matplotlib.figure import Figure
import matplotlib.patches
from matplotlib.cm import Set2
import numpy
from scipy.stats import gaussian_kde
import pandas

parser = argparse.ArgumentParser()
parser.add_argument("--source", help="Image file name",
                    type=str,default='modified.jpg')
parser.add_argument("--pickle", help="Pickled Textract results file name",
                    type=str,default='detection.pkl')
parser.add_argument("--benchmark", help="Benchmark results file name",
                    type=str,required=True)
parser.add_argument("--ndays", help="How many days in this month",
                    type=int,required=True)
parser.add_argument("--guides", help="Plot the day+hour guidelines",
                    type=bool,default=False)
parser.add_argument("--opimg", help="Image output file name",
                    default="oplot.png",
                    type=str,required=False)
parser.add_argument("--opstats", help="Statistics output file name",
                    default="stats.pkl",
                    type=str,required=False)
args = parser.parse_args()

# We're going to need the original image
im = Image.open(args.source)

# And the benchmark data
bm = pandas.read_csv(args.benchmark)

fig=Figure(figsize=((1*im.size[0]/100)*1.04,
                    (1*im.size[1]/100)*1.04),
       dpi=100,
       facecolor=(0.88,0.88,0.88,1),
       edgecolor=None,
       linewidth=0.0,
       frameon=False,
       subplotpars=None,
       tight_layout=None)
ax_original=fig.add_axes([0.02,0.02,0.96,0.96],label='original')
ax_result=fig.add_axes([0.02,0.02,0.96,0.96],label='result')
# Matplotlib magic
canvas=FigureCanvas(fig)
# Turn off the axis tics
ax_original.set_axis_off()
ax_result.set_axis_off()

# Show the original image
ax_original.imshow(im)

# Load the JSON from Textract for this image
textract=pickle.load( open( args.pickle, "rb" ) )

# Convert block polygon dictionary to numpy array for matplotlib
def d2p(dct):
    result=numpy.zeros((len(dct),2))
    for idx in range(len(dct)):
        result[idx,0]=dct[idx]['X']
        result[idx,1]=1.0-dct[idx]['Y']
    return result
# Get bounding box centroid for text
def b2t(dct):
    result=[0,0]
    result[0]=dct['Left']+dct['Width']/2
    result[1]=1.0-dct['Top']-dct['Height']/2
    return result
# Make fake bounding box around point for missing items
def m2p(x,y):
    result=numpy.zeros((4,2))
    result[0,0]=x-0.014
    result[0,1]=y-0.008
    result[1,0]=x-0.014
    result[1,1]=y+0.008
    result[2,0]=x+0.014
    result[2,1]=y+0.008
    result[3,0]=x+0.014
    result[3,1]=y-0.008
    return result

# Do a few obvious fix-ups on the Textract output
def fixup(text):
    # Insert the decimal point where it might have been missed
    if len(text)==4:
       text=text[0]+'.'+text[1:]
    # Replace any non-digit with decimal point
    for id in range(len(text)):
        if not text[id].isdigit():
            text=text[0:id]+'.'+text[id+1:]
    return text

def hasNumbers(inputString):
    return any(char.isdigit() for char in inputString)
# Find the column locations corresponding to hours,
#  and the row locations corresponding to days
xc=[]
yc=[]
for block in textract['Blocks']:
    if 'Text' in block and block['BlockType']=='WORD':
        if not hasNumbers(block['Text']): continue
        cent=b2t(block['Geometry']['BoundingBox'])
        xc.append(cent[0])
        yc.append(cent[1])

# Find clusters of points in a and y - these are the rows and columns
def get_columns(xc):
    kde = gaussian_kde(xc,bw_method=0.02)
    x_grid=numpy.linspace(0,1,1000)
    dens=kde.evaluate(x_grid)
    col=[]
    for i in range(1,len(x_grid)-1):
        if (dens[i]>1 and
            dens[i]>dens[i-1] and
            dens[i]>dens[i+1]):
            col.append(x_grid[i])
    return(col)

columns=get_columns(xc)
# If fewer than 26 columns we've lost some in the fold, add it back
while len(columns)<26:
   columns.insert(0,columns[0]-(columns[1]-columns[0]))
columns=columns[1:(len(columns)-1)]
rows=get_columns(yc)
# Image might or might not have a row of hour numbers
if len(rows)==args.ndays+2:
    rows=rows[1:(len(rows)-1)]
else:
    rows=rows[1:(len(rows))]

# Draw the breaks
if args.guides==True:
    for clm in columns:
        ax_result.add_line(matplotlib.lines.Line2D(
                xdata=(clm,clm),
                ydata=(0,1),
                linestyle='solid',
                linewidth=1,
                color=(1,0,0,1),
                zorder=5))
    for row in rows:
        ax_result.add_line(matplotlib.lines.Line2D(
                xdata=(0,1),
                ydata=(row,row),
                linestyle='solid',
                linewidth=1,
                color=(1,0,0,1),
                zorder=5))

# Keep track of good, bad, and missing data
stats={'Total':   0,
       'Good':    0,
       'Bad':     0,
       'Missing': 0}

# Make 2d array of blocks - for each row/column intersection
data_points=[[None] * len(columns) for i in range(len(rows))]
for block in textract['Blocks']:
    if 'Text' in block and block['BlockType']=='WORD':
        if (block['Geometry']['BoundingBox']['Width'] > 0.035 or
            block['Geometry']['BoundingBox']['Width'] < 0.025 or
            block['Geometry']['BoundingBox']['Height'] > 0.02 or
            block['Geometry']['BoundingBox']['Height'] < 0.01): continue
        at_column=None
        for cmi in range(len(columns)):
            clm=columns[cmi]
            if (block['Geometry']['BoundingBox']['Left']<clm and
                block['Geometry']['BoundingBox']['Left']+
                block['Geometry']['BoundingBox']['Width']>clm):
                at_column=cmi
                break
        if at_column is None: continue
        for rwi in range(len(rows)):
            row=rows[rwi]
            if (1.0-block['Geometry']['BoundingBox']['Top']>row and
                1.0-block['Geometry']['BoundingBox']['Top']-
                block['Geometry']['BoundingBox']['Height']<row):
                data_points[rwi][at_column]=block
                break

# Draw a marker at every hour - either a text block or a missing marker
for rwi in range(len(rows)):
   for cmi in range(len(columns)):
      stats['Total'] += 1
      if data_points[rwi][cmi] is None:
        # Mark as missing
           stats['Missing'] += 1
           pp=matplotlib.patches.Polygon(m2p(columns[cmi],rows[rwi]),
                                         closed=True,
                                         fill=False,
                                         hatch='/',
                                         edgecolor=(1,0,0,1),
                                         facecolor=(1,0,0,1),
                                         linewidth=1.0,
                                         alpha=1.0,
                                         zorder=10)
           ax_result.add_patch(pp)
      else:
          block=data_points[rwi][cmi]
          # Compare the Textract value with the benchmark
          try:
              bmvalue=bm.iloc[len(rows)-rwi-1][cmi+1].replace("'","")
          except:
              bmvalue=0.0
          if fixup(block['Text'])==bmvalue:
              stats['Good'] += 1
              bcol=(0.7,1,0.7,1)
          else:
              stats['Bad'] += 1
              bcol=(1,0.5,0.5,1)
          pp=matplotlib.patches.Polygon(d2p(block['Geometry']['Polygon']),
                                        closed=True,
                                        edgecolor=bcol,
                                        facecolor=bcol,
                                        fill=True,
                                        linewidth=0.2,
                                        alpha=0.85,
                                        zorder=10)
          ax_result.add_patch(pp)
       # Text
          txt_centroid=b2t(block['Geometry']['BoundingBox'])
          angle=0
          if (block['Geometry']['BoundingBox']['Height'] >
              block['Geometry']['BoundingBox']['Width']*2):
              angle=90
          ax_result.text(txt_centroid[0],txt_centroid[1],
                         fixup(block['Text']),
                         fontsize=18,
                         verticalalignment='center',
                         horizontalalignment='center',
                         rotation=angle,
                         zorder=10)


# Draw the image
fig.savefig(args.opimg)

# Output the stats
print(stats)
with open( args.opstats, "wb" ) as pkf:
    pickle.dump(stats, pkf )
