#!/usr/bin/env python
# Plot a comparison of original image and transcription results.
import pickle
import argparse
from PIL import Image
import matplotlib
from matplotlib.backends.backend_agg import \
FigureCanvasAgg as FigureCanvas
from matplotlib.figure import Figure
import matplotlib.patches
import numpy
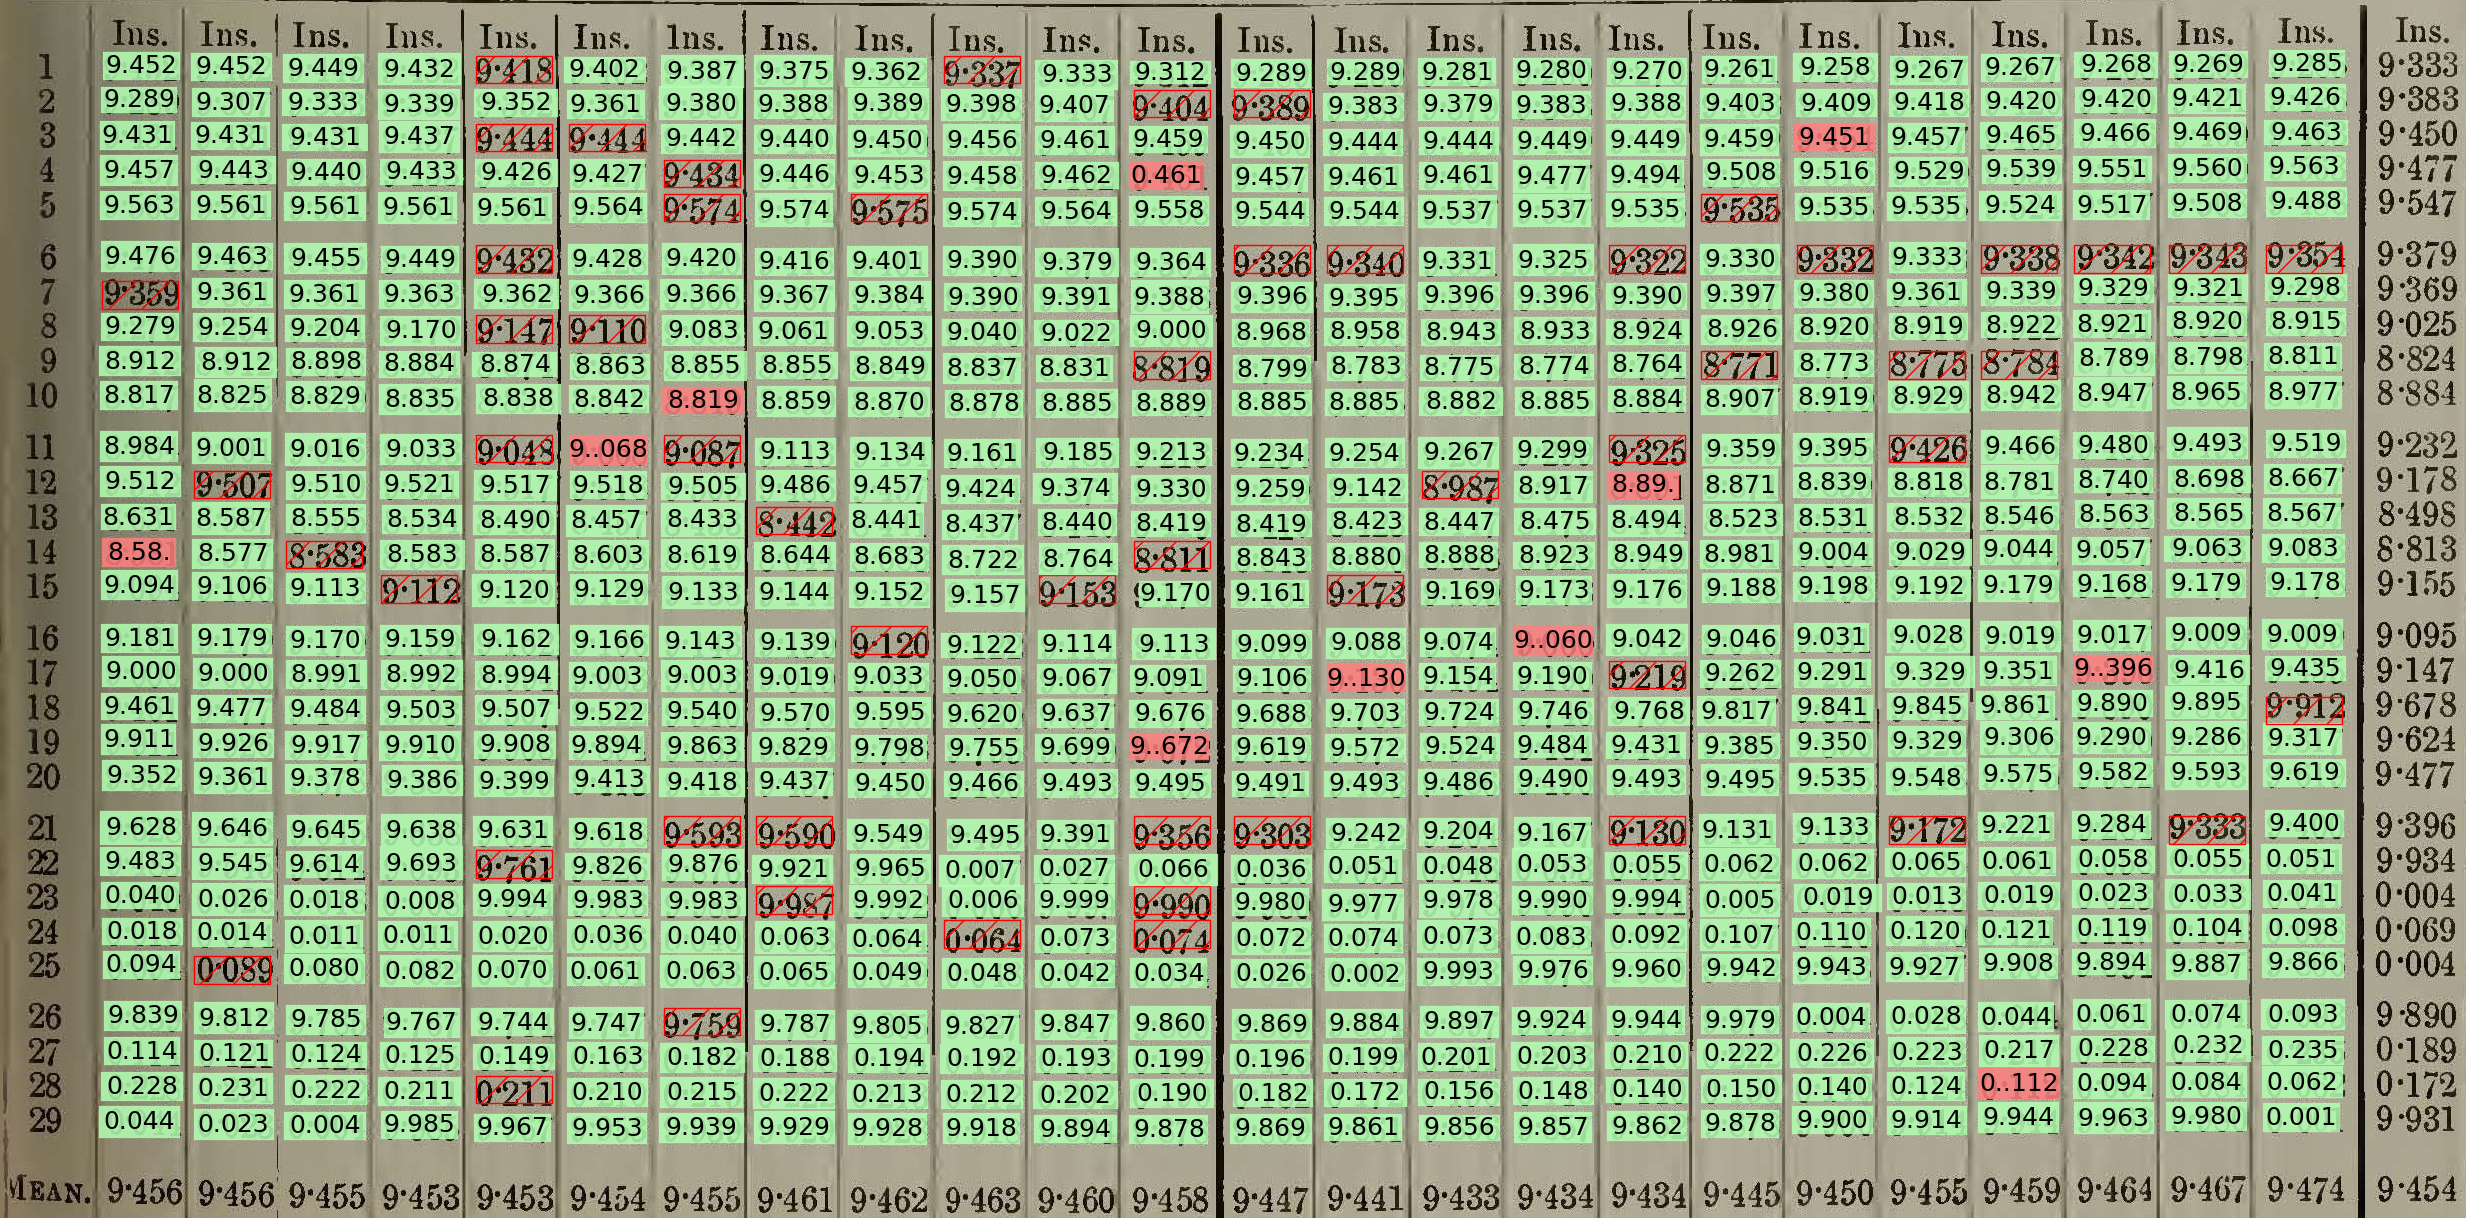
# We're going to need the original image
im = Image.open("../../../samples/1901-01.jpg")
fig=Figure(figsize=((im.size[0]/100)*1.04,
(im.size[1]/100)*1.04),
dpi=100,
facecolor=(0.88,0.88,0.88,1),
edgecolor=None,
linewidth=0.0,
frameon=False,
subplotpars=None,
tight_layout=None)
ax_original=fig.add_axes([0.02,0.02,0.96,0.96],label='original')
ax_result=fig.add_axes([0.02,0.02,0.96,0.96],label='result')
# Matplotlib magic
canvas=FigureCanvas(fig)
# Turn off the axis tics
ax_original.set_axis_off()
ax_result.set_axis_off()
# Put the original image in its half of the figure
ax_original.imshow(im)
# Load the JSON from Textract for this image
textract=pickle.load( open( "detection.pkl", "rb" ) )
# Convert block polygon dictionary to numpy array for matplotlib
def d2p(dct):
result=numpy.zeros((len(dct),2))
for idx in range(len(dct)):
result[idx,0]=dct[idx]['X']
result[idx,1]=1.0-dct[idx]['Y']
return result
# Convert block bounding box dictionary to numpy array for matplotlib
def b2p(dct):
result=numpy.zeros((4,2))
result[0,0]=dct['Left']
result[1,0]=dct['Left']+dct['Width']
result[2,0]=dct['Left']+dct['Width']
result[3,0]=dct['Left']
result[0,1]=1.0-dct['Top']
result[1,1]=1.0-dct['Top']
result[2,1]=1.0-dct['Top']-dct['Height']
result[3,1]=1.0-dct['Top']-dct['Height']
return result
# Draw all the blocks
zorder=10
for block in textract['Blocks']:
if block['BlockType'] == 'CELL': continue
if block['BlockType'] == 'PAGE': continue
if block['BlockType'] == 'TABLE': continue
# Bounding box
bp=matplotlib.patches.Polygon(b2p(block['Geometry']['BoundingBox']),
closed=True,
edgecolor=(1,0,0,1),
facecolor=(1,0,0,0.2),
fill=True,
linewidth=0.2,
alpha=0.2,
zorder=zorder)
# Don't bother to plot these - same as the polygons.
#if zorder>10: ax_result.add_patch(bp) # Skip 1st one - full page
# Polygon
pp=matplotlib.patches.Polygon(d2p(block['Geometry']['Polygon']),
closed=True,
edgecolor=(0,0,1,1),
facecolor=(0,0,1,0.2),
fill=True,
linewidth=0.2,
alpha=0.2,
zorder=zorder)
ax_result.add_patch(pp)
zorder=zorder+10
# Draw the image
fig.savefig('Polygons.png')