Default model - assimilate test data for a single month into trained model
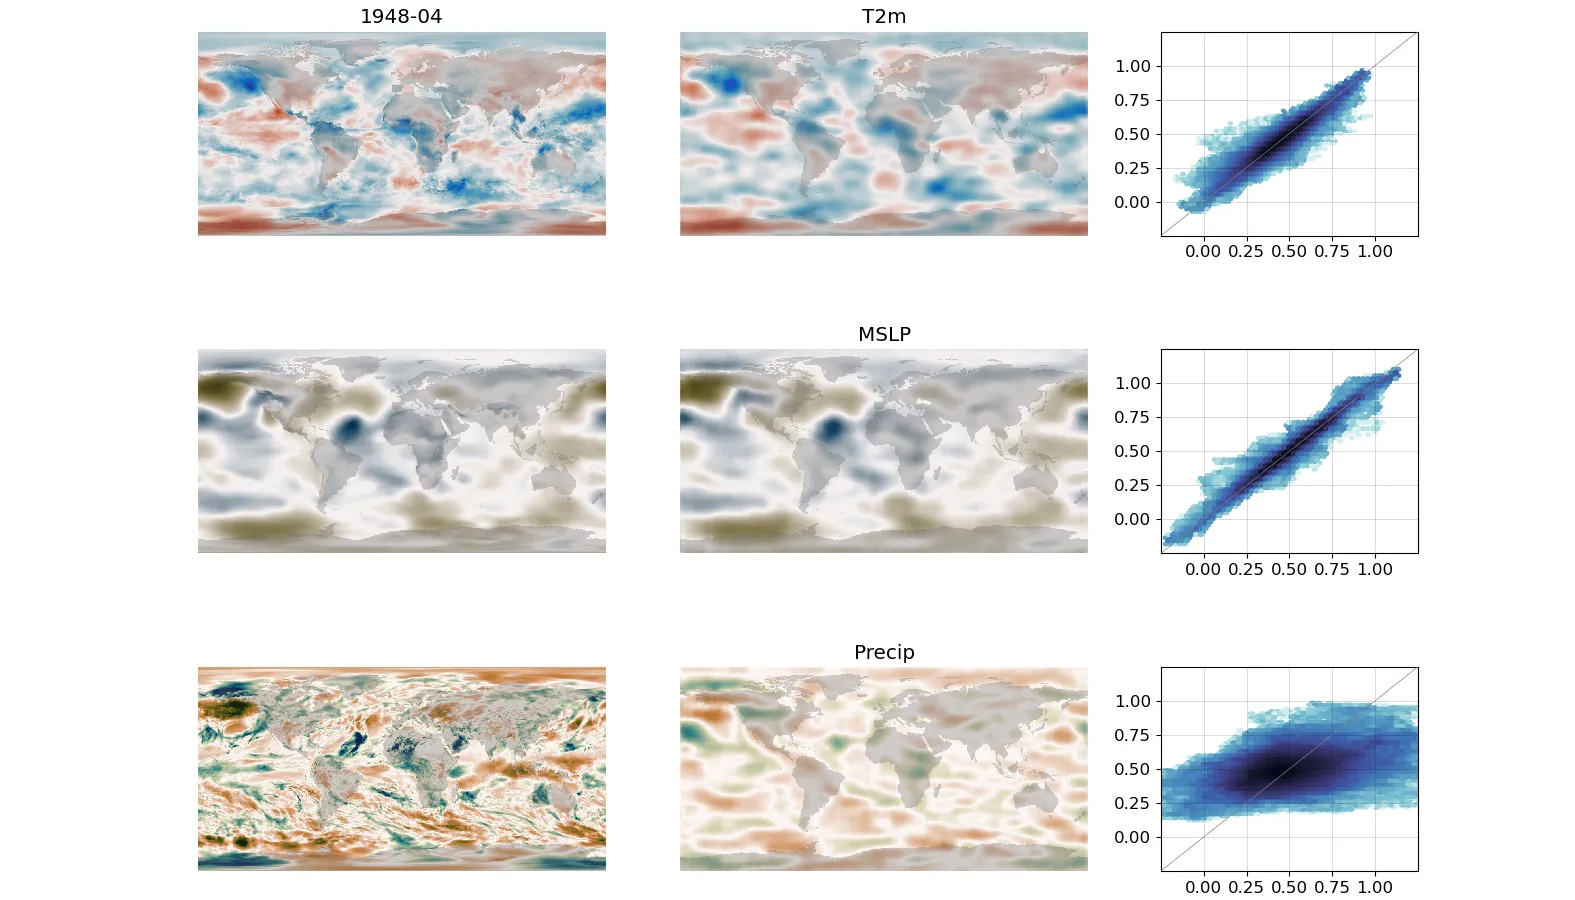
Left-hand column is the target, middle column is the DCVAE output assimilating T2m and MSLP, right-hand column is a scatter plot of target and output.
The objective is not just a good autoencoder, but a generator that is useful in making new output fields. The script assimilate.py generates new months using the trained model.
By default, it will use a random month from the test set, but you can specify a month using the –year and –month arguments. The –training argument will take months from the training set instead of the test set. By default, it won’t assimilate anything, specify variables to assimilate as arguments (so the figure above has arguments --T2m and --MSLP). Note that if you don’t assimilate anything - the model output won’t look like the model input. –epoch uses the model from a specific epoch.
#!/usr/bin/env python

# Find a point in latent space that maximises the fit to some given input fields,
#  and plot the fitted state.

import os
import sys
import numpy as np

# Supress TensorFlow moaning about cuda - we don't need a GPU for this
# Also the warning message confuses people.
os.environ["TF_CPP_MIN_LOG_LEVEL"] = "3"

import tensorflow as tf
import tensorflow_probability as tfp

from ML_models.default.makeDataset import getDataset
from ML_models.default.autoencoderModel import getModel

from ML_models.default.gmUtils import plotValidationField

from specify import specification

import argparse

parser = argparse.ArgumentParser()
parser.add_argument("--epoch", help="Epoch", type=int, required=False, default=500)
parser.add_argument(
    "--year", help="Year to fit to", type=int, required=False, default=None
)
parser.add_argument(
    "--month", help="Month to fit to", type=int, required=False, default=None
)
for field in specification["outputNames"]:
    parser.add_argument(
        "--%s" % field,
        help="Fit to %s?" % field,
        default=False,
        action="store_true",
    )
for field in specification["outputNames"]:
    parser.add_argument(
        "--%s_mask" % field,
        help="Mask for fit to %s?" % field,
        type=str,
        default=None,
    )
parser.add_argument(
    "--iter",
    help="No. of iterations",
    type=int,
    required=False,
    default=100,
)
parser.add_argument(
    "--training",
    help="Use training data (not test)",
    default=False,
    action="store_true",
)
args = parser.parse_args()
args_dict = vars(args)
# Load the masks, if specified
fitted = {}
masked = {}
for field in specification["outputNames"]:
    masked[field] = None
    if args_dict["%s_mask" % field] is not None:
        masked[field] = np.load(args_dict["%s_mask" % field])
    fitted[field] = args_dict[field]

purpose = "Test"
if args.training:
    purpose = "Train"
# Go through data and get the desired month
dataset = (
    getDataset(specification, purpose=purpose)
    .shuffle(specification["shuffleBufferSize"])
    .batch(1)
)
input = None
year = None
month = None
for batch in dataset:
    dateStr = batch[0][0].numpy().decode("utf-8")
    year = int(dateStr[:4])
    month = int(dateStr[5:7])
    if (args.month is None or month == args.month) and (
        args.year is None or year == args.year
    ):
        input = batch
        break

if input is None:
    raise Exception("Month %04d-%02d not in %s dataset" % (year, month, purpose))

autoencoder = getModel(specification, optimizer=None, epoch=args.epoch)

# We are using the model in inference mode - (does this have any effect?)
autoencoder.trainable = False

latent = tf.Variable(autoencoder.makeLatent())
if specification["outputTensors"] is not None:
    target = tf.constant(input[2][0], dtype=tf.float32)
else:
    target = tf.constant(input[1][0], dtype=tf.float32)


def decodeFit():
    result = 0.0
    generated = autoencoder.generate(latent, training=False)
    for field in specification["outputNames"]:
        if fitted[field]:
            field_idx = specification["outputNames"].index(field)
            mask = masked[field]
            if mask is not None:
                mask = tf.constant(mask, dtype=tf.float32)
                result = result + tf.reduce_mean(
                    tf.keras.metrics.mean_squared_error(
                        tf.boolean_mask(generated[0, :, :, field_idx], mask),
                        tf.boolean_mask(target[:, :, field_idx], mask),
                    )
                )
            else:
                result = result + tf.reduce_mean(
                    tf.keras.metrics.mean_squared_error(
                        generated[:, :, :, field_idx], target[:, :, field_idx]
                    )
                )
    return result


# If anything to assimilate, search for the latent space point that minimises the loss
if any(fitted.values()):
    loss = tfp.math.minimize(
        decodeFit,
        trainable_variables=[latent],
        num_steps=args.iter,
        optimizer=tf.optimizers.legacy.Adam(learning_rate=0.1),
    )

# Output is the generated value from the fitted latent space point
generated = autoencoder.generate(latent, training=False)

# Make the plot - same as for validation script
plotValidationField(specification, input, generated, year, month, "assimilated.webp")
Utility functions used in the plot
# Model utility functions

import os
import sys
import numpy as np

import datetime
import iris

import tensorflow as tf
from tensorflow.core.util import event_pb2
from tensorflow.python.framework import tensor_util

import matplotlib
from matplotlib.backends.backend_agg import FigureCanvasAgg as FigureCanvas
from matplotlib.figure import Figure
from matplotlib.patches import Rectangle
from matplotlib.lines import Line2D

import cmocean

from utilities import plots, grids


# Convenience function to make everything a list
# lists stay lists, scalars become len=1 lists.
def listify(input):
    if isinstance(input, str):
        input = [input]
    else:
        try:
            iter(input)
        except TypeError:
            input = [input]
        else:
            input = list(input)
    return input


# Load the history of a model from the Tensorboard logs
def loadHistory(LSC, offset=-1, max_epoch=None):
    history = {}
    summary_dir = "%s/DCVAE-Climate/%s/logs/Training" % (os.getenv("SCRATCH"), LSC)
    Rfiles = os.listdir(summary_dir)
    Rfiles.sort(key=lambda x: os.path.getmtime(os.path.join(summary_dir, x)))
    filename = Rfiles[offset]
    path = os.path.join(summary_dir, filename)
    serialized_records = tf.data.TFRecordDataset(path)
    history["epoch"] = []
    for srecord in serialized_records:
        event = event_pb2.Event.FromString(srecord.numpy())
        for value in event.summary.value:
            t = tensor_util.MakeNdarray(value.tensor)
            if not value.tag in history.keys():
                history[value.tag] = []
            if value.tag == "OutputNames":
                history[value.tag] = t
                continue
            if len(history[value.tag]) < event.step + 1:
                history[value.tag].extend(
                    [None] * (event.step + 1 - len(history[value.tag]))
                )
            history[value.tag][event.step] = t
        if len(history["epoch"]) < event.step + 1:
            history["epoch"].extend([None] * (event.step + 1 - len(history["epoch"])))
        history["epoch"][event.step] = event.step

    ymax = 0
    ymin = 1000000
    hts = {}
    n_epochs = len(history["Train_loss"])
    if max_epoch is not None:
        n_epochs = min(max_epoch, n_epochs)
    hts["epoch"] = list(range(n_epochs))[1:]
    hts["epoch"] = history["epoch"]
    for key in history:
        if key == "OutputNames":
            hts[key] = [str(t, "utf-8") for t in history[key]]
        else:
            hts[key] = [abs(t) for t in history[key][1:n_epochs] if t is not None]
    for key in ("Train_logpz", "Train_logqz_x", "Test_logpz", "Test_logqz_x"):
        ymax = max(ymax, max(hts[key]))
        ymin = min(ymin, min(hts[key]))

    return (hts, ymax, ymin, n_epochs)


# Choose colourmap based on variable name
def get_cmap(name):
    if name == "PRATE" or name == "Precip":
        return cmocean.cm.tarn
    elif name == "MSLP":
        return cmocean.cm.diff
    else:
        return cmocean.cm.balance


# Plot a single-field validation figure for the autoencoder.
def plotValidationField(specification, input, output, year, month, fileName):
    nFields = specification["nOutputChannels"]

    # Make the plot
    figScale = 3.0
    wRatios = (2, 2, 1.25)
    if specification["trainingMask"] is not None:
        wRatios = (2, 2, 1.25, 1.25)
    fig = Figure(
        figsize=(figScale * sum(wRatios), figScale * nFields),
        dpi=100,
        facecolor=(1, 1, 1, 1),
        edgecolor=None,
        linewidth=0.0,
        frameon=True,
        subplotpars=None,
        tight_layout=None,
    )
    canvas = FigureCanvas(fig)
    font = {
        "family": "DejaVu Sans",
        "sans-serif": "DejaVu Sans",
        "weight": "normal",
        "size": 12,
    }
    matplotlib.rc("font", **font)

    # Each variable a row in it's own subfigure
    subfigs = fig.subfigures(nFields, 1, wspace=0.01)
    if nFields == 1:
        subfigs = [subfigs]

    for varI in range(nFields):
        ax_var = subfigs[varI].subplots(
            nrows=1, ncols=len(wRatios), width_ratios=wRatios
        )
        # Left - map of target
        varx = grids.E5sCube.copy()
        varx.data = np.squeeze(input[-1][:, :, :, varI].numpy())
        varx.data = np.ma.masked_where(varx.data == 0.0, varx.data, copy=False)
        if varI == 0:
            ax_var[0].set_title("%04d-%02d" % (year, month))
        ax_var[0].set_axis_off()
        x_img = plots.plotFieldAxes(
            ax_var[0],
            varx,
            vMax=1.25,
            vMin=-0.25,
            cMap=get_cmap(specification["outputNames"][varI]),
        )
        # Centre - map of model output
        vary = grids.E5sCube.copy()
        vary.data = np.squeeze(output[:, :, :, varI].numpy())
        vary.data = np.ma.masked_where(varx.data == 0.0, vary.data, copy=False)
        ax_var[1].set_axis_off()
        ax_var[1].set_title(specification["outputNames"][varI])
        x_img = plots.plotFieldAxes(
            ax_var[1],
            vary,
            vMax=1.25,
            vMin=-0.25,
            cMap=get_cmap(specification["outputNames"][varI]),
        )
        # Third - scatter plot of input::output - where used for training
        ax_var[2].set_xticks([0, 0.25, 0.5, 0.75, 1])
        ax_var[2].set_yticks([0, 0.25, 0.5, 0.75, 1])
        if specification["trainingMask"] is not None:
            varxm = varx.copy()
            varym = vary.copy()
            mflat = specification["trainingMask"].numpy().squeeze()
            varxm.data = np.ma.masked_where(mflat == 1, varxm.data, copy=True)
            varym.data = np.ma.masked_where(mflat == 1, varym.data, copy=True)
            plots.plotScatterAxes(
                ax_var[2], varxm, varym, vMin=-0.25, vMax=1.25, bins="log"
            )
        else:
            plots.plotScatterAxes(
                ax_var[2], varx, vary, vMin=-0.25, vMax=1.25, bins="log"
            )
        # Fourth only if masked - scatter plot of input::output - where masked out of training
        if specification["trainingMask"] is not None:
            ax_var[3].set_xticks([0, 0.25, 0.5, 0.75, 1])
            ax_var[3].set_yticks([0, 0.25, 0.5, 0.75, 1])
            mflat = specification["trainingMask"].numpy().squeeze()
            varx.data = np.ma.masked_where(mflat == 0, varx.data, copy=True)
            vary.data = np.ma.masked_where(mflat == 0, vary.data, copy=True)
            plots.plotScatterAxes(
                ax_var[3], varx, vary, vMin=-0.25, vMax=1.25, bins="log"
            )

    fig.savefig(fileName)


def plotTrainingMetrics(
    specification, hts, fileName="training.webp", chts=None, aymax=None, epoch=None
):
    fig = Figure(
        figsize=(15, 5),
        dpi=100,
        facecolor=(1, 1, 1, 1),
        edgecolor=None,
        linewidth=0.0,
        frameon=True,
        subplotpars=None,
        tight_layout=None,
    )
    canvas = FigureCanvas(fig)
    font = {
        "family": "DejaVu Sans",
        "sans-serif": "DejaVu Sans",
        "weight": "normal",
        "size": 12,
    }
    matplotlib.rc("font", **font)

    def addLine(ax, dta, key, col, z, idx=0, rscale=1):
        dtp = [listify(x)[idx] for x in dta[key] if len(listify(x)) > idx]
        dta2 = [
            dta["epoch"][i]
            for i in range(len(dta[key]))
            if len(listify(dta[key][i])) > idx
        ]
        ax.add_line(
            Line2D(
                dta2,
                np.array(dtp) * rscale,
                linewidth=2,
                color=col,
                alpha=1.0,
                zorder=z,
            )
        )

    # Three subfigures
    # Left - for the overall loss
    # Centre, for the RMS components
    # Right, for the KL-divergence components
    subfigs = fig.subfigures(1, 3, wspace=0.07)

    # Left - Main loss
    ymaxL = max(1, max(hts["Train_loss"] + hts["Test_loss"]))
    if chts is not None:
        ymaxL = max(ymaxL, max(chts["Train_loss"] + chts["Test_loss"]))
    if aymax is not None:
        ymaxL = aymax
    subfigs[0].subplots_adjust(left=0.2)
    ax_loss = subfigs[0].subplots(nrows=1, ncols=1)
    ax_loss.set_xlim(left=-1, right=epoch + 1, auto=False)
    ax_loss.set_ylim(bottom=0, top=ymaxL, auto=False)
    ax_loss.set_ylabel("Overall loss")
    ax_loss.set_xlabel("epoch")
    ax_loss.grid(color=(0, 0, 0, 1), linestyle="-", linewidth=0.1)

    addLine(ax_loss, hts, "Train_loss", (1, 0.5, 0.5, 1), 10)
    addLine(ax_loss, hts, "Test_loss", (1, 0, 0, 1), 20)
    if chts is not None:
        addLine(ax_loss, chts, "Train_loss", (0.5, 0.5, 1, 1), 10)
        addLine(ax_loss, chts, "Test_loss", (0, 0, 1, 1), 20)

    # Centre, plot each RMS component as a separate subplot.
    comp_font_size = 10
    nvar = len(hts["OutputNames"])
    # Layout n plots in an (a,b) grid
    try:
        subplotLayout = [
            None,
            (1, 1),
            (1, 2),
            (2, 2),
            (2, 2),
            (2, 3),
            (2, 3),
            (3, 3),
            (3, 3),
            (3, 3),
        ][nvar + 1]
    except Exception:
        raise Exception("No subplot layout for %d plots" % nvar)
    if subplotLayout is None:
        raise Exception("No output names found")
    ax_rmse = subfigs[1].subplots(
        nrows=subplotLayout[0],
        ncols=subplotLayout[1],
        sharex=True,
        sharey=True,
        squeeze=False,
    )
    ax_rmse = [item for row in ax_rmse for item in row]  # Flatten
    ax_rmse[0].set_xlim(-1, epoch + 1)
    ax_rmse[0].set_ylim(0, ymaxL)
    ax_rmse[0].set_ylabel("Variance fraction", fontsize=comp_font_size)
    ax_rmse[nvar].set_xlabel("Epoch", fontsize=comp_font_size)
    for varI in range(nvar):
        ax_rmse[varI].tick_params(axis="both", labelsize=comp_font_size)
        ax_rmse[varI].set_title(hts["OutputNames"][varI], fontsize=comp_font_size)
        ax_rmse[varI].grid(color=(0, 0, 0, 1), linestyle="-", linewidth=0.1)
        addLine(ax_rmse[varI], hts, "Train_RMSE", (1, 0.5, 0.5, 1), 10, idx=varI)
        addLine(ax_rmse[varI], hts, "Test_RMSE", (1, 0, 0, 1), 20, idx=varI)
        if specification["trainingMask"] is not None:
            addLine(
                ax_rmse[varI], hts, "Train_RMSE_masked", (0.5, 0.5, 1, 1), 10, idx=varI
            )
            addLine(ax_rmse[varI], hts, "Test_RMSE_masked", (0, 0, 1, 1), 20, idx=varI)
        if chts is not None:
            for idx in range(len(chts["OutputNames"])):
                if chts["OutputNames"][idx] == hts["OutputNames"][varI]:
                    addLine(
                        ax_rmse[varI], chts, "Train_RMSE", (0.5, 0.5, 1, 1), 10, idx=idx
                    )
                    addLine(ax_rmse[varI], chts, "Test_RMSE", (0, 0, 1, 1), 20, idx=idx)
                    break
    ax_rmse[nvar].tick_params(axis="both", labelsize=comp_font_size)
    ax_rmse[nvar].set_title("Regularization", fontsize=comp_font_size)
    ax_rmse[nvar].grid(color=(0, 0, 0, 1), linestyle="-", linewidth=0.1)
    addLine(ax_rmse[nvar], hts, "Regularization_loss", (1, 0, 0, 1), 20)
    if chts is not None:
        addLine(ax_rmse[nvar], chts, "Regularization_loss", (0, 0, 1, 1), 20)
    for varI in range(nvar + 1, len(ax_rmse)):
        ax_rmse[varI].set_axis_off()

    # Right - KL-divergence plots
    ax_kld = subfigs[2].subplots(
        nrows=2,
        ncols=1,
        sharex=True,
        sharey=False,
    )
    ax_kld[0].set_xlim(-1, epoch + 1)
    ymaxL = max(hts["Train_logpz"] + hts["Test_logpz"])
    yminL = min(hts["Train_logpz"] + hts["Test_logpz"])
    if chts is not None:
        ymaxL = max(ymaxL, max(chts["Train_logpz"] + chts["Test_logpz"]))
        yminL = min(yminL, min(chts["Train_logpz"] + chts["Test_logpz"]))
    ymaxL += (ymaxL - yminL) / 20
    yminL -= (ymaxL - yminL) / 21
    ax_kld[0].set_ylim(yminL, ymaxL)
    ax_kld[0].set_title("KL Divergence")
    ax_kld[0].set_ylabel("logpz")
    ax_kld[0].set_xlabel("")
    ax_kld[0].grid(color=(0, 0, 0, 1), linestyle="-", linewidth=0.1)
    addLine(ax_kld[0], hts, "Train_logpz", (1, 0.5, 0.5, 1), 10)
    addLine(ax_kld[0], hts, "Test_logpz", (1, 0, 0, 1), 20)
    if chts is not None:
        addLine(ax_kld[0], chts, "Train_logpz", (0.5, 0.5, 1, 1), 10)
        addLine(ax_kld[0], chts, "Test_logpz", (0, 0, 1, 1), 20)

    ymaxL = max(hts["Train_logqz_x"] + hts["Test_logqz_x"])
    yminL = min(hts["Train_logqz_x"] + hts["Test_logqz_x"])
    if chts is not None:
        ymaxL = max(ymaxL, max(chts["Train_logqz_x"] + chts["Test_logqz_x"]))
        yminL = min(yminL, min(chts["Train_logqz_x"] + chts["Test_logqz_x"]))
    ymaxL += (ymaxL - yminL) / 20
    yminL -= (ymaxL - yminL) / 21
    ax_kld[1].set_ylim(yminL, ymaxL)
    ax_kld[1].set_ylabel("logqz_x")
    ax_kld[1].set_xlabel("epoch")
    ax_kld[1].grid(color=(0, 0, 0, 1), linestyle="-", linewidth=0.1)
    addLine(ax_kld[1], hts, "Train_logqz_x", (1, 0.5, 0.5, 1), 10)
    addLine(ax_kld[1], hts, "Test_logqz_x", (1, 0, 0, 1), 20)
    if chts is not None:
        addLine(ax_kld[1], chts, "Train_logqz_x", (0.5, 0.5, 1, 1), 10)
        addLine(ax_kld[1], chts, "Test_logqz_x", (0, 0, 1, 1), 20)

    # Output as png
    fig.savefig(fileName)


# Get target and encoded scalar statistics for one test case
def computeScalarStats(
    specification, x, generated, min_lat=-90, max_lat=90, min_lon=-180, max_lon=180
):
    nFields = specification["nOutputChannels"]

    # get the date from the filename tensor
    dateStr = x[0][0].numpy().decode("utf-8")
    year = int(dateStr[:4])
    month = int(dateStr[5:7])
    dtp = datetime.date(year, month, 15)

    def tensor_to_cube(t):
        result = grids.E5sCube.copy()
        result.data = np.squeeze(t.numpy())
        result.data = np.ma.masked_where(result.data == 0.0, result.data, copy=False)
        return result

    def field_to_scalar(field):
        field = field.extract(
            iris.Constraint(
                coord_values={"grid_latitude": lambda cell: min_lat <= cell <= max_lat}
            )
            & iris.Constraint(
                coord_values={"grid_longitude": lambda cell: min_lon <= cell <= max_lon}
            )
        )
        return np.mean(field.data)

    stats = {}
    stats["dtp"] = dtp
    stats["target"] = {}
    stats["generated"] = {}
    for varI in range(nFields):
        if specification["trainingMask"] is None:
            stats["target"][specification["outputNames"][varI]] = field_to_scalar(
                tensor_to_cube(tf.squeeze(x[-1][:, :, :, varI])),
            )
            stats["generated"][specification["outputNames"][varI]] = field_to_scalar(
                tensor_to_cube(tf.squeeze(generated[:, :, :, varI])),
            )
        else:
            mask = specification["trainingMask"].numpy().squeeze()
            stats["target"][specification["outputNames"][varI]] = field_to_scalar(
                tensor_to_cube(tf.squeeze(x[-1][:, :, :, varI] * mask)),
            )
            stats["target"]["%s_masked" % specification["outputNames"][varI]] = (
                field_to_scalar(
                    tensor_to_cube(tf.squeeze(x[-1][:, :, :, varI] * (1 - mask))),
                )
            )
            stats["generated"][specification["outputNames"][varI]] = field_to_scalar(
                tensor_to_cube(tf.squeeze(generated[:, :, :, varI] * mask)),
            )
            stats["generated"]["%s_masked" % specification["outputNames"][varI]] = (
                field_to_scalar(
                    tensor_to_cube(tf.squeeze(generated[:, :, :, varI] * (1 - mask))),
                )
            )
    return stats


def plotScalarStats(all_stats, specification, fileName="multi.webp"):
    nFields = specification["nOutputChannels"]
    if specification["trainingMask"] is not None:
        nFields *= 2

    figScale = 3.0
    wRatios = (3, 1.25)

    # Make the plot
    fig = Figure(
        figsize=(figScale * sum(wRatios), figScale * nFields),
        dpi=300,
        facecolor=(1, 1, 1, 1),
        edgecolor=None,
        linewidth=0.0,
        frameon=True,
        subplotpars=None,
        tight_layout=None,
    )
    canvas = FigureCanvas(fig)
    font = {
        "family": "DejaVu Sans",
        "sans-serif": "DejaVu Sans",
        "weight": "normal",
        "size": 14,
    }
    matplotlib.rc("font", **font)

    # Plot a variable in its subfigure
    def plot_var(sfig, ts, t, m, label):
        # Get two axes in the subfig
        var_axes = sfig.subplots(nrows=1, ncols=2, width_ratios=wRatios, squeeze=False)

        # Calculate y range
        ymin = min(min(t), min(m))
        ymax = max(max(t), max(m))
        ypad = (ymax - ymin) * 0.1
        if ypad == 0:
            ypad = 1

        # First subaxis for time-series plot
        var_axes[0, 0].set_xlim(
            ts[0] - datetime.timedelta(days=15), ts[-1] + datetime.timedelta(days=15)
        )
        var_axes[0, 0].set_ylim(ymin - ypad, ymax + ypad)
        var_axes[0, 0].grid(color=(0, 0, 0, 1), linestyle="-", linewidth=0.1)
        var_axes[0, 0].text(
            ts[0] - datetime.timedelta(days=15),
            ymax + ypad,
            label,
            ha="left",
            va="top",
            bbox=dict(boxstyle="square,pad=0.5", fc=(1, 1, 1, 1)),
            zorder=100,
        )
        var_axes[0, 0].add_line(
            Line2D(ts, t, linewidth=2, color=(0, 0, 0, 1), alpha=1.0, zorder=50)
        )
        var_axes[0, 0].add_line(
            Line2D(ts, m, linewidth=2, color=(1, 0, 0, 1), alpha=1.0, zorder=60)
        )

        # Second subaxis for scatter plot
        var_axes[0, 1].set_xlim(ymin - ypad, ymax + ypad),
        var_axes[0, 1].set_ylim(ymin - ypad, ymax + ypad),
        var_axes[0, 1].grid(color=(0, 0, 0, 1), linestyle="-", linewidth=0.1)
        var_axes[0, 1].scatter(t, m, s=2, color=(1, 0, 0, 1), zorder=60)
        var_axes[0, 1].add_line(
            Line2D(
                (ymin - ypad, ymax + ypad),
                (ymin - ypad, ymax + ypad),
                linewidth=1,
                color=(0, 0, 0, 1),
                alpha=0.2,
                zorder=10,
            )
        )

    # Each variable in its own subfig
    subfigs = fig.subfigures(nFields, 1, wspace=0.01)
    if nFields == 1:
        subfigs = [subfigs]
    for varI in range(len(specification["outputNames"])):
        if specification["trainingMask"] is None:
            vName = specification["outputNames"][varI]
            plot_var(
                subfigs[varI],
                all_stats["dtp"],
                all_stats["target"][vName],
                all_stats["generated"][vName],
                vName,
            )
        else:
            vName = specification["outputNames"][varI]
            plot_var(
                subfigs[varI * 2],
                all_stats["dtp"],
                all_stats["target"][vName],
                all_stats["generated"][vName],
                vName,
            )
            vName = "%s_masked" % specification["outputNames"][varI]
            plot_var(
                subfigs[varI * 2 + 1],
                all_stats["dtp"],
                all_stats["target"][vName],
                all_stats["generated"][vName],
                specification["outputNames"][varI] + " (masked)",
            )

    fig.savefig(fileName)