Default model - plot training history
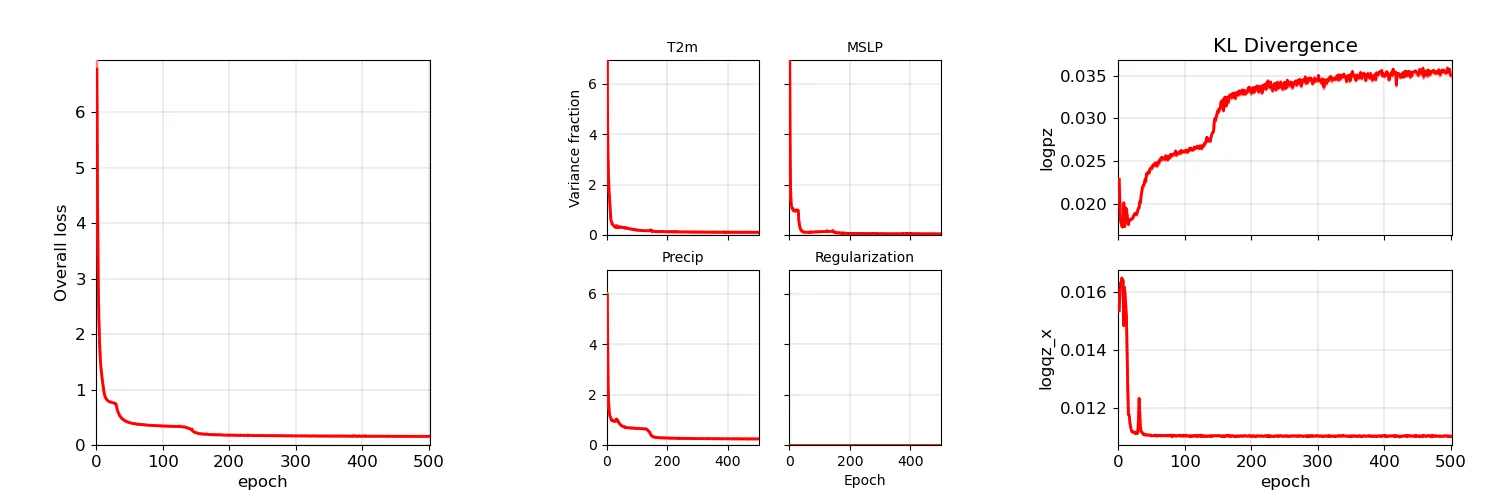
Plot of a sample model training history - darker lines are the validation data, lighter lines are the training data. Red lines are for regions with training data, blue lines for regions without.
Script (plot_training_progress.py) to make the validation figure
#!/usr/bin/env python

# Plot time-series of training progress

import os

# Cut down on the TensorFlow warning messages
os.environ["TF_CPP_MIN_LOG_LEVEL"] = "3"


from specify import specification
from ML_models.default.gmUtils import loadHistory, plotTrainingMetrics

import argparse

# I don't need all the messages about a missing font
import logging

logging.getLogger("matplotlib.font_manager").disabled = True

parser = argparse.ArgumentParser()
parser.add_argument(
    "--comparator", help="Comparison model name", type=str, required=False, default=None
)
parser.add_argument(
    "--selfc", help="Compare with previous run", type=int, required=False, default=None
)
parser.add_argument(
    "--rscale",
    help="Scale RMS losses in comparator",
    type=float,
    required=False,
    default=1.0,
)
parser.add_argument(
    "--ymax", help="Y range maximum", type=float, required=False, default=None
)
parser.add_argument(
    "--ymin", help="Y range minimum", type=float, required=False, default=None
)
parser.add_argument(
    "--max_epoch", help="Max epoch to plot", type=int, required=False, default=None
)
args = parser.parse_args()

hts = None
chts = None

(hts, ymax, ymin, epoch) = loadHistory(
    specification["modelName"],
)

if args.selfc is not None:
    (chts, cymax, cymin, cepoch) = loadHistory(specification["modelName"], args.selfc)
    epoch = max(epoch, cepoch)
    ymax = max(ymax, cymax)
    ymin = min(ymin, cymin)

if args.comparator is not None:
    (chts, cymax, cymin, cepoch) = loadHistory(args.comparator)
    epoch = max(epoch, cepoch)
    ymax = max(ymax, cymax)
    ymin = min(ymin, cymin)


plotTrainingMetrics(
    specification,
    hts,
    fileName="training.webp",
    chts=chts,
    aymax=args.ymax,
    epoch=epoch,
)
Utility functions used in the plot
# Model utility functions

import os
import sys
import numpy as np

import datetime
import iris

import tensorflow as tf
from tensorflow.core.util import event_pb2
from tensorflow.python.framework import tensor_util

import matplotlib
from matplotlib.backends.backend_agg import FigureCanvasAgg as FigureCanvas
from matplotlib.figure import Figure
from matplotlib.patches import Rectangle
from matplotlib.lines import Line2D

import cmocean

from utilities import plots, grids


# Convenience function to make everything a list
# lists stay lists, scalars become len=1 lists.
def listify(input):
    if isinstance(input, str):
        input = [input]
    else:
        try:
            iter(input)
        except TypeError:
            input = [input]
        else:
            input = list(input)
    return input


# Load the history of a model from the Tensorboard logs
def loadHistory(LSC, offset=-1, max_epoch=None):
    history = {}
    summary_dir = "%s/DCVAE-Climate/%s/logs/Training" % (os.getenv("SCRATCH"), LSC)
    Rfiles = os.listdir(summary_dir)
    Rfiles.sort(key=lambda x: os.path.getmtime(os.path.join(summary_dir, x)))
    filename = Rfiles[offset]
    path = os.path.join(summary_dir, filename)
    serialized_records = tf.data.TFRecordDataset(path)
    history["epoch"] = []
    for srecord in serialized_records:
        event = event_pb2.Event.FromString(srecord.numpy())
        for value in event.summary.value:
            t = tensor_util.MakeNdarray(value.tensor)
            if not value.tag in history.keys():
                history[value.tag] = []
            if value.tag == "OutputNames":
                history[value.tag] = t
                continue
            if len(history[value.tag]) < event.step + 1:
                history[value.tag].extend(
                    [None] * (event.step + 1 - len(history[value.tag]))
                )
            history[value.tag][event.step] = t
        if len(history["epoch"]) < event.step + 1:
            history["epoch"].extend([None] * (event.step + 1 - len(history["epoch"])))
        history["epoch"][event.step] = event.step

    ymax = 0
    ymin = 1000000
    hts = {}
    n_epochs = len(history["Train_loss"])
    if max_epoch is not None:
        n_epochs = min(max_epoch, n_epochs)
    hts["epoch"] = list(range(n_epochs))[1:]
    hts["epoch"] = history["epoch"]
    for key in history:
        if key == "OutputNames":
            hts[key] = [str(t, "utf-8") for t in history[key]]
        else:
            hts[key] = [abs(t) for t in history[key][1:n_epochs] if t is not None]
    for key in ("Train_logpz", "Train_logqz_x", "Test_logpz", "Test_logqz_x"):
        ymax = max(ymax, max(hts[key]))
        ymin = min(ymin, min(hts[key]))

    return (hts, ymax, ymin, n_epochs)


# Choose colourmap based on variable name
def get_cmap(name):
    if name == "PRATE" or name == "Precip":
        return cmocean.cm.tarn
    elif name == "MSLP":
        return cmocean.cm.diff
    else:
        return cmocean.cm.balance


# Plot a single-field validation figure for the autoencoder.
def plotValidationField(specification, input, output, year, month, fileName):
    nFields = specification["nOutputChannels"]

    # Make the plot
    figScale = 3.0
    wRatios = (2, 2, 1.25)
    if specification["trainingMask"] is not None:
        wRatios = (2, 2, 1.25, 1.25)
    fig = Figure(
        figsize=(figScale * sum(wRatios), figScale * nFields),
        dpi=100,
        facecolor=(1, 1, 1, 1),
        edgecolor=None,
        linewidth=0.0,
        frameon=True,
        subplotpars=None,
        tight_layout=None,
    )
    canvas = FigureCanvas(fig)
    font = {
        "family": "DejaVu Sans",
        "sans-serif": "DejaVu Sans",
        "weight": "normal",
        "size": 12,
    }
    matplotlib.rc("font", **font)

    # Each variable a row in it's own subfigure
    subfigs = fig.subfigures(nFields, 1, wspace=0.01)
    if nFields == 1:
        subfigs = [subfigs]

    for varI in range(nFields):
        ax_var = subfigs[varI].subplots(
            nrows=1, ncols=len(wRatios), width_ratios=wRatios
        )
        # Left - map of target
        varx = grids.E5sCube.copy()
        varx.data = np.squeeze(input[-1][:, :, :, varI].numpy())
        varx.data = np.ma.masked_where(varx.data == 0.0, varx.data, copy=False)
        if varI == 0:
            ax_var[0].set_title("%04d-%02d" % (year, month))
        ax_var[0].set_axis_off()
        x_img = plots.plotFieldAxes(
            ax_var[0],
            varx,
            vMax=1.25,
            vMin=-0.25,
            cMap=get_cmap(specification["outputNames"][varI]),
        )
        # Centre - map of model output
        vary = grids.E5sCube.copy()
        vary.data = np.squeeze(output[:, :, :, varI].numpy())
        vary.data = np.ma.masked_where(varx.data == 0.0, vary.data, copy=False)
        ax_var[1].set_axis_off()
        ax_var[1].set_title(specification["outputNames"][varI])
        x_img = plots.plotFieldAxes(
            ax_var[1],
            vary,
            vMax=1.25,
            vMin=-0.25,
            cMap=get_cmap(specification["outputNames"][varI]),
        )
        # Third - scatter plot of input::output - where used for training
        ax_var[2].set_xticks([0, 0.25, 0.5, 0.75, 1])
        ax_var[2].set_yticks([0, 0.25, 0.5, 0.75, 1])
        if specification["trainingMask"] is not None:
            varxm = varx.copy()
            varym = vary.copy()
            mflat = specification["trainingMask"].numpy().squeeze()
            varxm.data = np.ma.masked_where(mflat == 1, varxm.data, copy=True)
            varym.data = np.ma.masked_where(mflat == 1, varym.data, copy=True)
            plots.plotScatterAxes(
                ax_var[2], varxm, varym, vMin=-0.25, vMax=1.25, bins="log"
            )
        else:
            plots.plotScatterAxes(
                ax_var[2], varx, vary, vMin=-0.25, vMax=1.25, bins="log"
            )
        # Fourth only if masked - scatter plot of input::output - where masked out of training
        if specification["trainingMask"] is not None:
            ax_var[3].set_xticks([0, 0.25, 0.5, 0.75, 1])
            ax_var[3].set_yticks([0, 0.25, 0.5, 0.75, 1])
            mflat = specification["trainingMask"].numpy().squeeze()
            varx.data = np.ma.masked_where(mflat == 0, varx.data, copy=True)
            vary.data = np.ma.masked_where(mflat == 0, vary.data, copy=True)
            plots.plotScatterAxes(
                ax_var[3], varx, vary, vMin=-0.25, vMax=1.25, bins="log"
            )

    fig.savefig(fileName)


def plotTrainingMetrics(
    specification, hts, fileName="training.webp", chts=None, aymax=None, epoch=None
):
    fig = Figure(
        figsize=(15, 5),
        dpi=100,
        facecolor=(1, 1, 1, 1),
        edgecolor=None,
        linewidth=0.0,
        frameon=True,
        subplotpars=None,
        tight_layout=None,
    )
    canvas = FigureCanvas(fig)
    font = {
        "family": "DejaVu Sans",
        "sans-serif": "DejaVu Sans",
        "weight": "normal",
        "size": 12,
    }
    matplotlib.rc("font", **font)

    def addLine(ax, dta, key, col, z, idx=0, rscale=1):
        dtp = [listify(x)[idx] for x in dta[key] if len(listify(x)) > idx]
        dta2 = [
            dta["epoch"][i]
            for i in range(len(dta[key]))
            if len(listify(dta[key][i])) > idx
        ]
        ax.add_line(
            Line2D(
                dta2,
                np.array(dtp) * rscale,
                linewidth=2,
                color=col,
                alpha=1.0,
                zorder=z,
            )
        )

    # Three subfigures
    # Left - for the overall loss
    # Centre, for the RMS components
    # Right, for the KL-divergence components
    subfigs = fig.subfigures(1, 3, wspace=0.07)

    # Left - Main loss
    ymaxL = max(1, max(hts["Train_loss"] + hts["Test_loss"]))
    if chts is not None:
        ymaxL = max(ymaxL, max(chts["Train_loss"] + chts["Test_loss"]))
    if aymax is not None:
        ymaxL = aymax
    subfigs[0].subplots_adjust(left=0.2)
    ax_loss = subfigs[0].subplots(nrows=1, ncols=1)
    ax_loss.set_xlim(left=-1, right=epoch + 1, auto=False)
    ax_loss.set_ylim(bottom=0, top=ymaxL, auto=False)
    ax_loss.set_ylabel("Overall loss")
    ax_loss.set_xlabel("epoch")
    ax_loss.grid(color=(0, 0, 0, 1), linestyle="-", linewidth=0.1)

    addLine(ax_loss, hts, "Train_loss", (1, 0.5, 0.5, 1), 10)
    addLine(ax_loss, hts, "Test_loss", (1, 0, 0, 1), 20)
    if chts is not None:
        addLine(ax_loss, chts, "Train_loss", (0.5, 0.5, 1, 1), 10)
        addLine(ax_loss, chts, "Test_loss", (0, 0, 1, 1), 20)

    # Centre, plot each RMS component as a separate subplot.
    comp_font_size = 10
    nvar = len(hts["OutputNames"])
    # Layout n plots in an (a,b) grid
    try:
        subplotLayout = [
            None,
            (1, 1),
            (1, 2),
            (2, 2),
            (2, 2),
            (2, 3),
            (2, 3),
            (3, 3),
            (3, 3),
            (3, 3),
        ][nvar + 1]
    except Exception:
        raise Exception("No subplot layout for %d plots" % nvar)
    if subplotLayout is None:
        raise Exception("No output names found")
    ax_rmse = subfigs[1].subplots(
        nrows=subplotLayout[0],
        ncols=subplotLayout[1],
        sharex=True,
        sharey=True,
        squeeze=False,
    )
    ax_rmse = [item for row in ax_rmse for item in row]  # Flatten
    ax_rmse[0].set_xlim(-1, epoch + 1)
    ax_rmse[0].set_ylim(0, ymaxL)
    ax_rmse[0].set_ylabel("Variance fraction", fontsize=comp_font_size)
    ax_rmse[nvar].set_xlabel("Epoch", fontsize=comp_font_size)
    for varI in range(nvar):
        ax_rmse[varI].tick_params(axis="both", labelsize=comp_font_size)
        ax_rmse[varI].set_title(hts["OutputNames"][varI], fontsize=comp_font_size)
        ax_rmse[varI].grid(color=(0, 0, 0, 1), linestyle="-", linewidth=0.1)
        addLine(ax_rmse[varI], hts, "Train_RMSE", (1, 0.5, 0.5, 1), 10, idx=varI)
        addLine(ax_rmse[varI], hts, "Test_RMSE", (1, 0, 0, 1), 20, idx=varI)
        if specification["trainingMask"] is not None:
            addLine(
                ax_rmse[varI], hts, "Train_RMSE_masked", (0.5, 0.5, 1, 1), 10, idx=varI
            )
            addLine(ax_rmse[varI], hts, "Test_RMSE_masked", (0, 0, 1, 1), 20, idx=varI)
        if chts is not None:
            for idx in range(len(chts["OutputNames"])):
                if chts["OutputNames"][idx] == hts["OutputNames"][varI]:
                    addLine(
                        ax_rmse[varI], chts, "Train_RMSE", (0.5, 0.5, 1, 1), 10, idx=idx
                    )
                    addLine(ax_rmse[varI], chts, "Test_RMSE", (0, 0, 1, 1), 20, idx=idx)
                    break
    ax_rmse[nvar].tick_params(axis="both", labelsize=comp_font_size)
    ax_rmse[nvar].set_title("Regularization", fontsize=comp_font_size)
    ax_rmse[nvar].grid(color=(0, 0, 0, 1), linestyle="-", linewidth=0.1)
    addLine(ax_rmse[nvar], hts, "Regularization_loss", (1, 0, 0, 1), 20)
    if chts is not None:
        addLine(ax_rmse[nvar], chts, "Regularization_loss", (0, 0, 1, 1), 20)
    for varI in range(nvar + 1, len(ax_rmse)):
        ax_rmse[varI].set_axis_off()

    # Right - KL-divergence plots
    ax_kld = subfigs[2].subplots(
        nrows=2,
        ncols=1,
        sharex=True,
        sharey=False,
    )
    ax_kld[0].set_xlim(-1, epoch + 1)
    ymaxL = max(hts["Train_logpz"] + hts["Test_logpz"])
    yminL = min(hts["Train_logpz"] + hts["Test_logpz"])
    if chts is not None:
        ymaxL = max(ymaxL, max(chts["Train_logpz"] + chts["Test_logpz"]))
        yminL = min(yminL, min(chts["Train_logpz"] + chts["Test_logpz"]))
    ymaxL += (ymaxL - yminL) / 20
    yminL -= (ymaxL - yminL) / 21
    ax_kld[0].set_ylim(yminL, ymaxL)
    ax_kld[0].set_title("KL Divergence")
    ax_kld[0].set_ylabel("logpz")
    ax_kld[0].set_xlabel("")
    ax_kld[0].grid(color=(0, 0, 0, 1), linestyle="-", linewidth=0.1)
    addLine(ax_kld[0], hts, "Train_logpz", (1, 0.5, 0.5, 1), 10)
    addLine(ax_kld[0], hts, "Test_logpz", (1, 0, 0, 1), 20)
    if chts is not None:
        addLine(ax_kld[0], chts, "Train_logpz", (0.5, 0.5, 1, 1), 10)
        addLine(ax_kld[0], chts, "Test_logpz", (0, 0, 1, 1), 20)

    ymaxL = max(hts["Train_logqz_x"] + hts["Test_logqz_x"])
    yminL = min(hts["Train_logqz_x"] + hts["Test_logqz_x"])
    if chts is not None:
        ymaxL = max(ymaxL, max(chts["Train_logqz_x"] + chts["Test_logqz_x"]))
        yminL = min(yminL, min(chts["Train_logqz_x"] + chts["Test_logqz_x"]))
    ymaxL += (ymaxL - yminL) / 20
    yminL -= (ymaxL - yminL) / 21
    ax_kld[1].set_ylim(yminL, ymaxL)
    ax_kld[1].set_ylabel("logqz_x")
    ax_kld[1].set_xlabel("epoch")
    ax_kld[1].grid(color=(0, 0, 0, 1), linestyle="-", linewidth=0.1)
    addLine(ax_kld[1], hts, "Train_logqz_x", (1, 0.5, 0.5, 1), 10)
    addLine(ax_kld[1], hts, "Test_logqz_x", (1, 0, 0, 1), 20)
    if chts is not None:
        addLine(ax_kld[1], chts, "Train_logqz_x", (0.5, 0.5, 1, 1), 10)
        addLine(ax_kld[1], chts, "Test_logqz_x", (0, 0, 1, 1), 20)

    # Output as png
    fig.savefig(fileName)


# Get target and encoded scalar statistics for one test case
def computeScalarStats(
    specification, x, generated, min_lat=-90, max_lat=90, min_lon=-180, max_lon=180
):
    nFields = specification["nOutputChannels"]

    # get the date from the filename tensor
    dateStr = x[0][0].numpy().decode("utf-8")
    year = int(dateStr[:4])
    month = int(dateStr[5:7])
    dtp = datetime.date(year, month, 15)

    def tensor_to_cube(t):
        result = grids.E5sCube.copy()
        result.data = np.squeeze(t.numpy())
        result.data = np.ma.masked_where(result.data == 0.0, result.data, copy=False)
        return result

    def field_to_scalar(field):
        field = field.extract(
            iris.Constraint(
                coord_values={"grid_latitude": lambda cell: min_lat <= cell <= max_lat}
            )
            & iris.Constraint(
                coord_values={"grid_longitude": lambda cell: min_lon <= cell <= max_lon}
            )
        )
        return np.mean(field.data)

    stats = {}
    stats["dtp"] = dtp
    stats["target"] = {}
    stats["generated"] = {}
    for varI in range(nFields):
        if specification["trainingMask"] is None:
            stats["target"][specification["outputNames"][varI]] = field_to_scalar(
                tensor_to_cube(tf.squeeze(x[-1][:, :, :, varI])),
            )
            stats["generated"][specification["outputNames"][varI]] = field_to_scalar(
                tensor_to_cube(tf.squeeze(generated[:, :, :, varI])),
            )
        else:
            mask = specification["trainingMask"].numpy().squeeze()
            stats["target"][specification["outputNames"][varI]] = field_to_scalar(
                tensor_to_cube(tf.squeeze(x[-1][:, :, :, varI] * mask)),
            )
            stats["target"]["%s_masked" % specification["outputNames"][varI]] = (
                field_to_scalar(
                    tensor_to_cube(tf.squeeze(x[-1][:, :, :, varI] * (1 - mask))),
                )
            )
            stats["generated"][specification["outputNames"][varI]] = field_to_scalar(
                tensor_to_cube(tf.squeeze(generated[:, :, :, varI] * mask)),
            )
            stats["generated"]["%s_masked" % specification["outputNames"][varI]] = (
                field_to_scalar(
                    tensor_to_cube(tf.squeeze(generated[:, :, :, varI] * (1 - mask))),
                )
            )
    return stats


def plotScalarStats(all_stats, specification, fileName="multi.webp"):
    nFields = specification["nOutputChannels"]
    if specification["trainingMask"] is not None:
        nFields *= 2

    figScale = 3.0
    wRatios = (3, 1.25)

    # Make the plot
    fig = Figure(
        figsize=(figScale * sum(wRatios), figScale * nFields),
        dpi=300,
        facecolor=(1, 1, 1, 1),
        edgecolor=None,
        linewidth=0.0,
        frameon=True,
        subplotpars=None,
        tight_layout=None,
    )
    canvas = FigureCanvas(fig)
    font = {
        "family": "DejaVu Sans",
        "sans-serif": "DejaVu Sans",
        "weight": "normal",
        "size": 14,
    }
    matplotlib.rc("font", **font)

    # Plot a variable in its subfigure
    def plot_var(sfig, ts, t, m, label):
        # Get two axes in the subfig
        var_axes = sfig.subplots(nrows=1, ncols=2, width_ratios=wRatios, squeeze=False)

        # Calculate y range
        ymin = min(min(t), min(m))
        ymax = max(max(t), max(m))
        ypad = (ymax - ymin) * 0.1
        if ypad == 0:
            ypad = 1

        # First subaxis for time-series plot
        var_axes[0, 0].set_xlim(
            ts[0] - datetime.timedelta(days=15), ts[-1] + datetime.timedelta(days=15)
        )
        var_axes[0, 0].set_ylim(ymin - ypad, ymax + ypad)
        var_axes[0, 0].grid(color=(0, 0, 0, 1), linestyle="-", linewidth=0.1)
        var_axes[0, 0].text(
            ts[0] - datetime.timedelta(days=15),
            ymax + ypad,
            label,
            ha="left",
            va="top",
            bbox=dict(boxstyle="square,pad=0.5", fc=(1, 1, 1, 1)),
            zorder=100,
        )
        var_axes[0, 0].add_line(
            Line2D(ts, t, linewidth=2, color=(0, 0, 0, 1), alpha=1.0, zorder=50)
        )
        var_axes[0, 0].add_line(
            Line2D(ts, m, linewidth=2, color=(1, 0, 0, 1), alpha=1.0, zorder=60)
        )

        # Second subaxis for scatter plot
        var_axes[0, 1].set_xlim(ymin - ypad, ymax + ypad),
        var_axes[0, 1].set_ylim(ymin - ypad, ymax + ypad),
        var_axes[0, 1].grid(color=(0, 0, 0, 1), linestyle="-", linewidth=0.1)
        var_axes[0, 1].scatter(t, m, s=2, color=(1, 0, 0, 1), zorder=60)
        var_axes[0, 1].add_line(
            Line2D(
                (ymin - ypad, ymax + ypad),
                (ymin - ypad, ymax + ypad),
                linewidth=1,
                color=(0, 0, 0, 1),
                alpha=0.2,
                zorder=10,
            )
        )

    # Each variable in its own subfig
    subfigs = fig.subfigures(nFields, 1, wspace=0.01)
    if nFields == 1:
        subfigs = [subfigs]
    for varI in range(len(specification["outputNames"])):
        if specification["trainingMask"] is None:
            vName = specification["outputNames"][varI]
            plot_var(
                subfigs[varI],
                all_stats["dtp"],
                all_stats["target"][vName],
                all_stats["generated"][vName],
                vName,
            )
        else:
            vName = specification["outputNames"][varI]
            plot_var(
                subfigs[varI * 2],
                all_stats["dtp"],
                all_stats["target"][vName],
                all_stats["generated"][vName],
                vName,
            )
            vName = "%s_masked" % specification["outputNames"][varI]
            plot_var(
                subfigs[varI * 2 + 1],
                all_stats["dtp"],
                all_stats["target"][vName],
                all_stats["generated"][vName],
                specification["outputNames"][varI] + " (masked)",
            )

    fig.savefig(fileName)