Check gamma distributions for ERA5 data
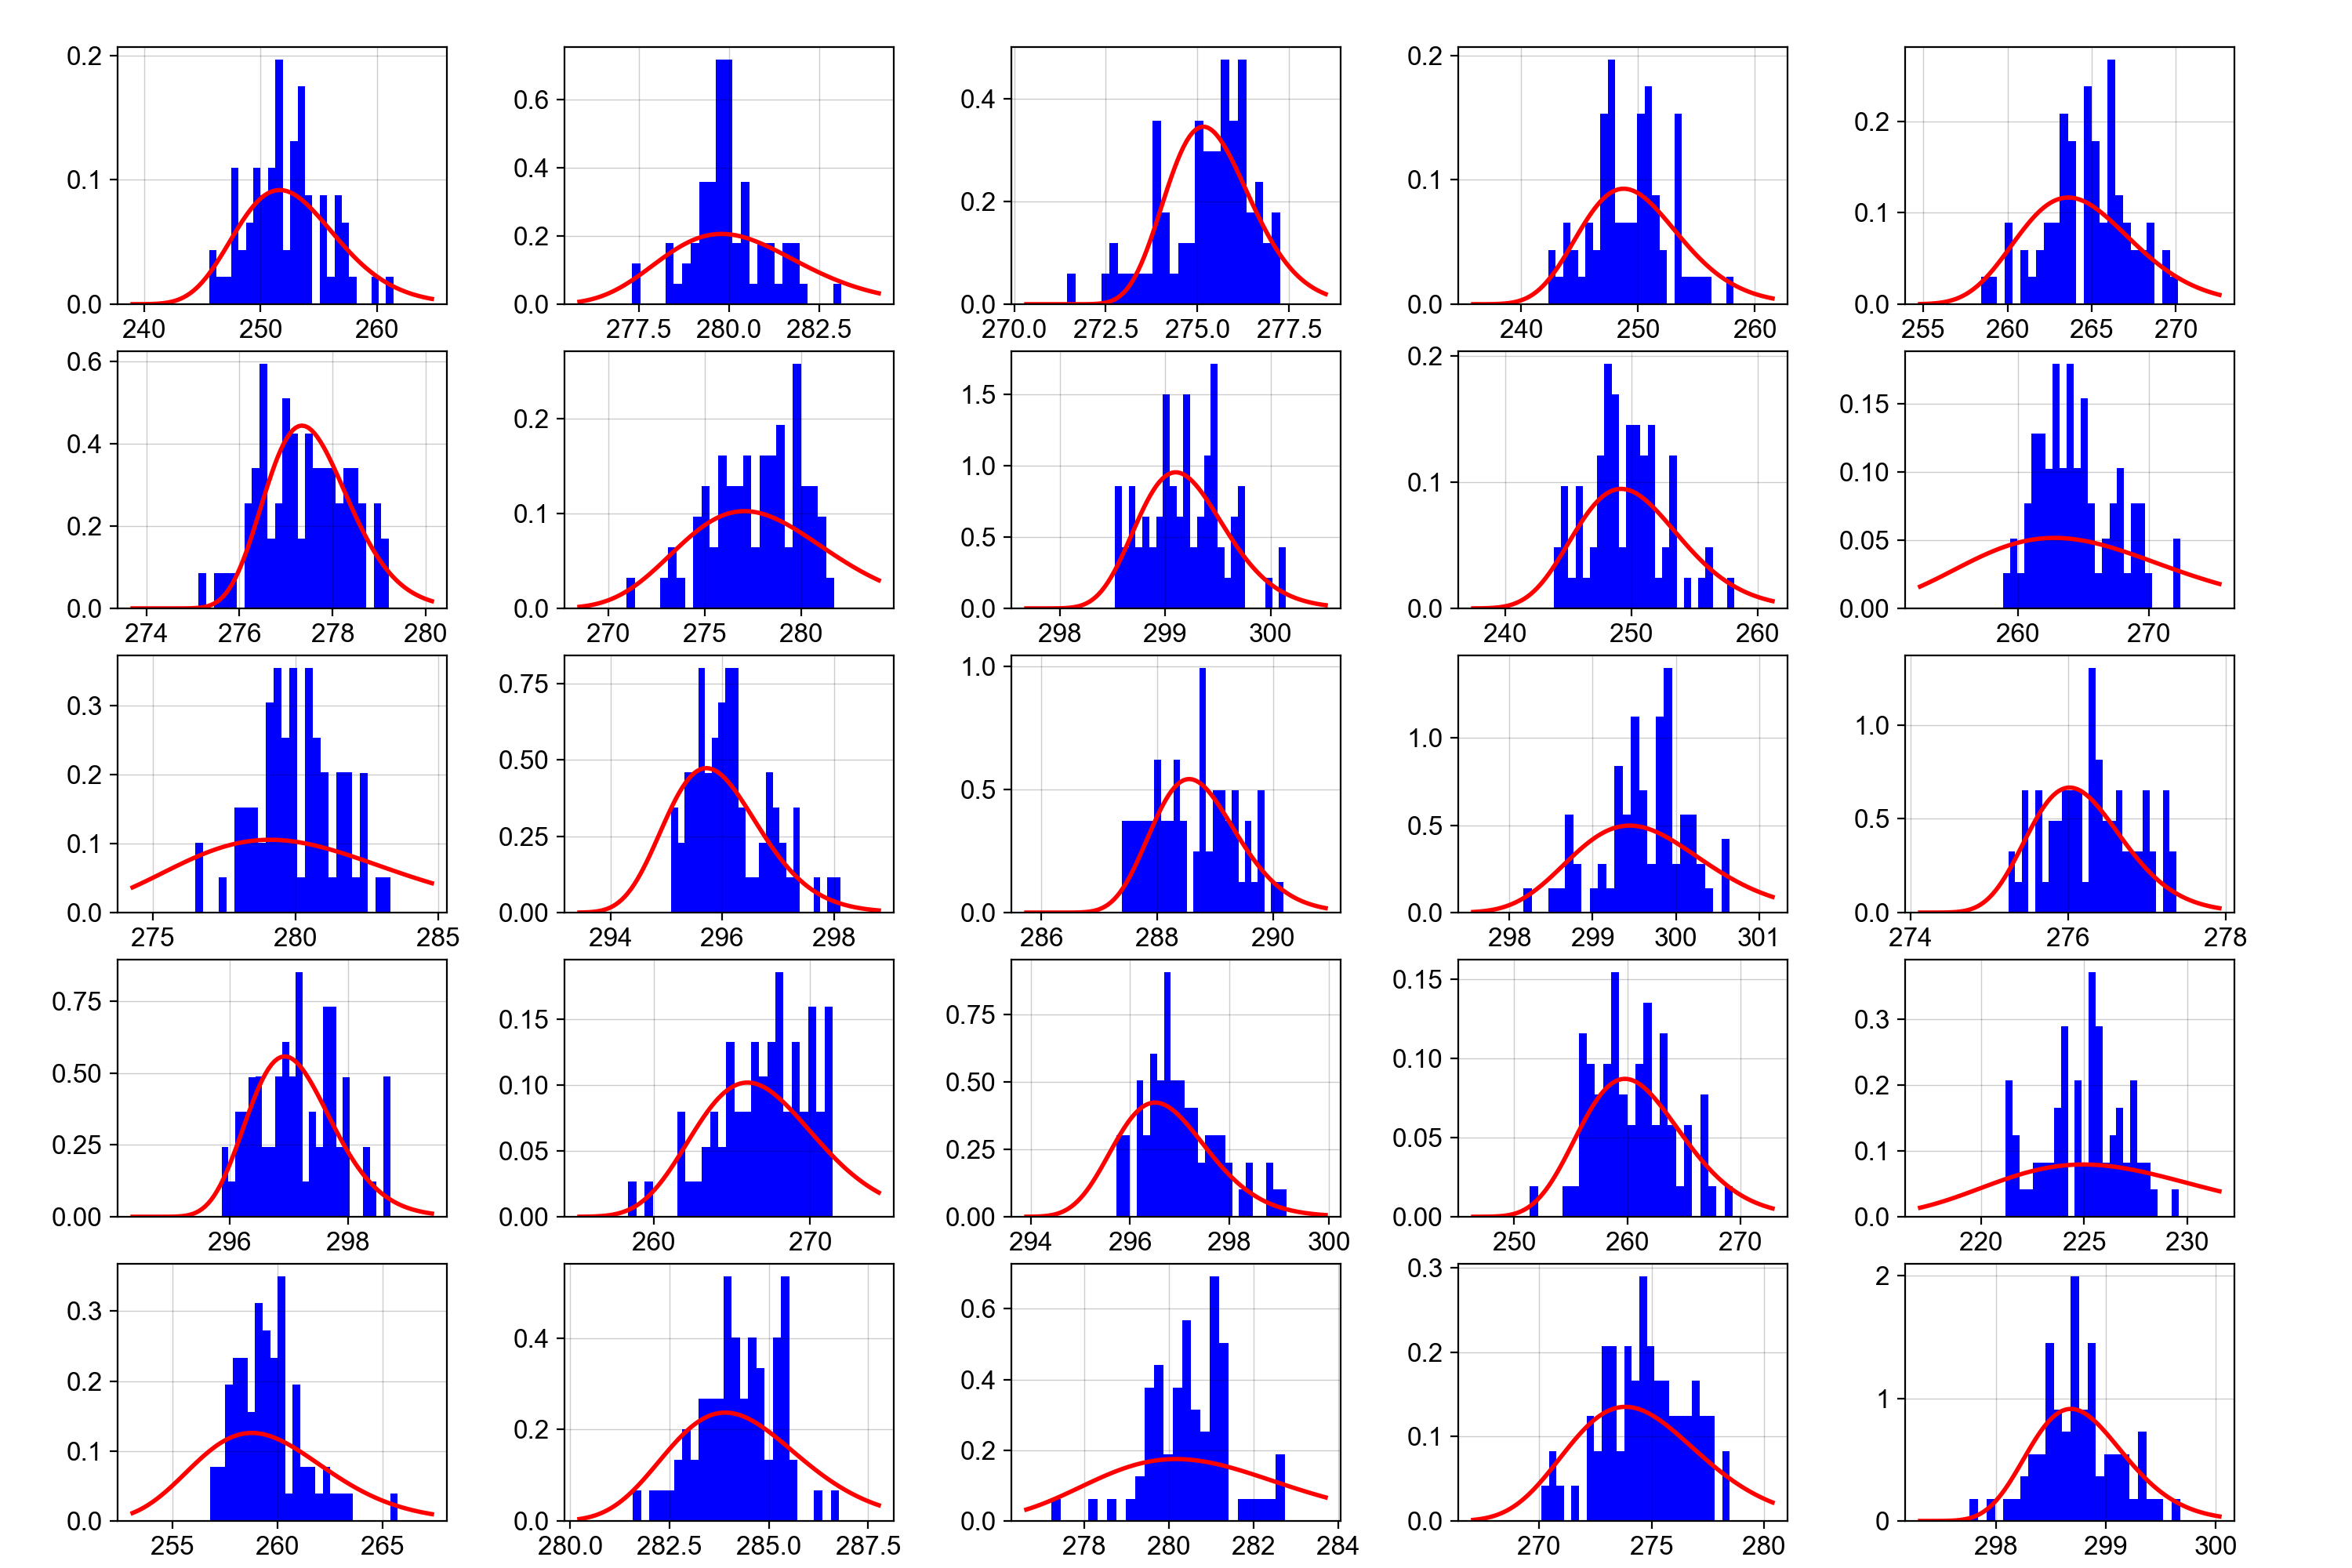
Data histograms and fitted gamma distributions for 25 random grid points of ERA5 March temperature.
It’s worth checking that the gamma distributions fitted to the training data are sensible. (They don’t have to be very good, we don’t have much data to fit to, but they do have to be reasonable, and there’s nothing like a quick graphical check to see if they are.) The script plot_sample_fits.py does this for 25 random grid points. It takes –variable and –month as arguments.
Script to make the plot:
#!/usr/bin/env python

# Plot gamma fits to sample data points

import os
import sys
import iris
import iris.cube
import numpy as np
import argparse
import numpy as np

# Supress TensorFlow moaning about cuda - we don't need a GPU for this
# Also the warning message confuses people.
os.environ["TF_CPP_MIN_LOG_LEVEL"] = "3"

import tensorflow as tf

from makeDataset import getDataset


from normalize import load_fitted
from scipy.stats import gamma

from utilities import plots

import matplotlib
from matplotlib.backends.backend_agg import FigureCanvasAgg as FigureCanvas
from matplotlib.figure import Figure
from matplotlib.patches import Rectangle
from matplotlib.lines import Line2D

rng = np.random.default_rng()

parser = argparse.ArgumentParser()
parser.add_argument(
    "--month", help="Month to extract", type=int, required=False, default=3
)
parser.add_argument(
    "--variable",
    help="Variable to use",
    type=str,
    required=False,
    default="total_precipitation",
)
parser.add_argument(
    "--startyear", help="Start Year", type=int, required=False, default=1950
)
parser.add_argument(
    "--endyear", help="End Year", type=int, required=False, default=2022
)
args = parser.parse_args()

# Select 25 grid-cells to show
random_i = rng.choice(range(721), size=25, replace=False)
random_j = rng.choice(range(1440), size=25, replace=False)
raw = []
for i in range(25):
    raw.append([])

# Get the data
trainingData = getDataset(
    args.variable,
    startyear=args.startyear,
    endyear=args.endyear,
    cache=False,
).batch(1)
for batch in trainingData:
    month = int(batch[1].numpy()[0][5:7])
    if month == args.month:
        for i in range(25):
            raw[i].append(batch[0].numpy()[0, random_i[i], random_j[i], 0])

# Load the fitted values
(shape, location, scale) = load_fitted(args.month, variable=args.variable)

# Make the fitted curve for each sample
m_values = []
m_fit = []
for i in range(25):
    m_values.append([])
    m_fit.append([])
    x_min = np.mean(raw[i]) - np.std(raw[i]) * 4
    x_max = np.max(raw[i]) + np.std(raw[i])
    m_values[i] = np.linspace(x_min, x_max, num=100)
    m_fit[i] = gamma.pdf(
        m_values[i],
        shape.data[random_i[i], random_j[i]],
        loc=location.data[random_i[i], random_j[i]],
        scale=scale.data[random_i[i], random_j[i]],
    )

# Make the plot
fig = Figure(
    figsize=(15, 10),
    dpi=200,
    facecolor=(0.5, 0.5, 0.5, 1),
    edgecolor=None,
    linewidth=0.0,
    frameon=False,
    subplotpars=None,
    tight_layout=None,
)
canvas = FigureCanvas(fig)
font = {
    "family": "sans-serif",
    "sans-serif": "DejaVu Sans",
    "weight": "normal",
    "size": 12,
}
matplotlib.rc("font", **font)
axb = fig.add_axes([0, 0, 1, 1])
axb.set_axis_off()
axb.add_patch(
    Rectangle(
        (0, 0),
        1,
        1,
        facecolor=(1.0, 1.0, 1.0, 1),
        fill=True,
        zorder=1,
    )
)


# Make an axes for each sample
def make_axes(sample_i):
    x_i = sample_i % 5
    y_i = sample_i // 5
    xmargin = 0.05
    ymargin = 0.03
    width = (1 - xmargin * 6) / 5
    height = (1 - ymargin * 6) / 5
    x_offset = xmargin + (width + xmargin) * x_i
    y_offset = ymargin + (height + ymargin) * y_i
    ax_sample = fig.add_axes([x_offset, y_offset, width, height])
    return ax_sample


for i in range(25):
    ax = make_axes(i)
    araw = raw[i]
    plots.plotHistAxes(ax, iris.cube.Cube(araw), bins=25)
    ax.add_line(Line2D(m_values[i], m_fit[i], color="red", linewidth=2))


fig.savefig("samples_%s_m%02d.webp" % (args.variable, args.month))